Brain Computer Interfacing
Klaus-Robert Mller, Carmen Vidaurre, Matthias Treder, Siamac Fazli, Jan Mehnert, Stefan Haufe, Frank Meinecke, Felix Biessmann, Michael Tangermann, Gabriel Curio, Benjamin Blankertz et al.
Brain Computer Interfacing (BCI) aims at making use of brain signals for e.g. the control of objects, spelling, gaming and so on. This tutorial will first provide a brief overview of the current BCI research activities and provide details in recent developments on both invasive and non-invasive BCI systems. In a second part – taking a physiologist point of view – the necessary neurological/neurophysical background is provided and medical applications are discussed. The third part – now from a machine learning and signal processing perspective – shows the wealth, the complexity and the difficulties of the data available, a truely enormous challenge. In real-time a multi-variate very noise contaminated data stream is to be processed and classified. Main emphasis of this part of the tutorial is placed on feature extraction/selection, dealing with nonstationarity and preprocessing which includes among other techniques CSP. Finally, I report in more detail about the Berlin Brain Computer (BBCI) Interface that is based on EEG signals and take the audience all the way from the measured signal, the preprocessing and filtering, the classification to the respective application. BCI communication is discussed in a clinical setting and for gaming.
Scroll with j/k | | | Size

Brain Computer Interfacing
Klaus-Robert Mller, Carmen Vidaurre, Matthias Treder, Siamac Fazli, Jan Mehnert, Stefan Haufe, Frank Meinecke, Felix Biessmann, Michael Tangermann, Gabriel Curio, Benjamin Blankertz et al.
1
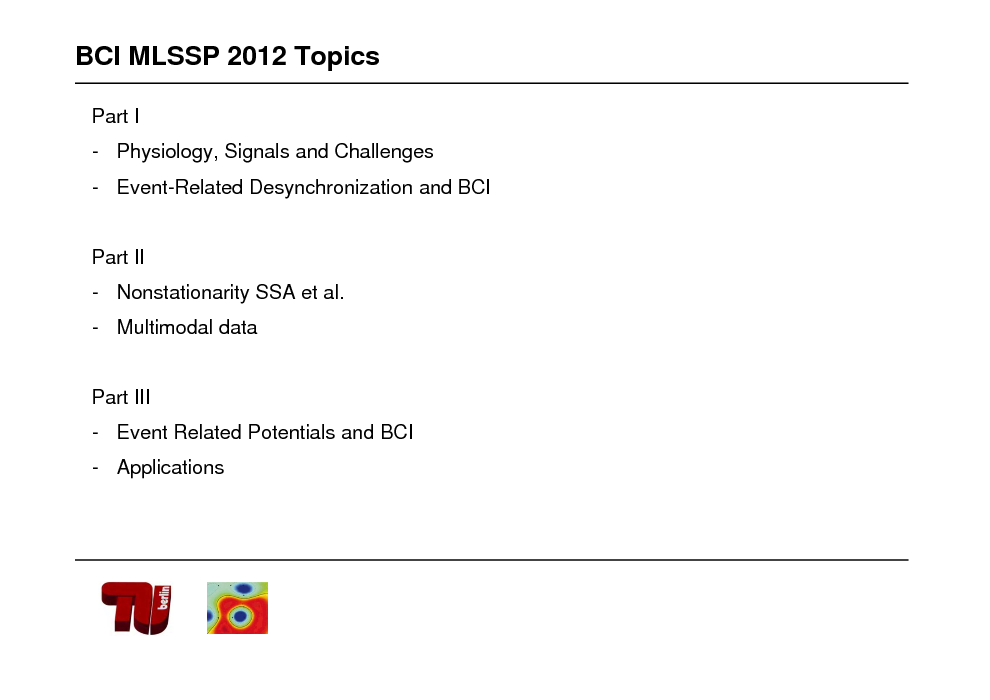
BCI MLSSP 2012 Topics
Part I - Physiology, Signals and Challenges - Event-Related Desynchronization and BCI
Part II - Nonstationarity SSA et al. - Multimodal data
Part III - Event Related Potentials and BCI
- Applications
2
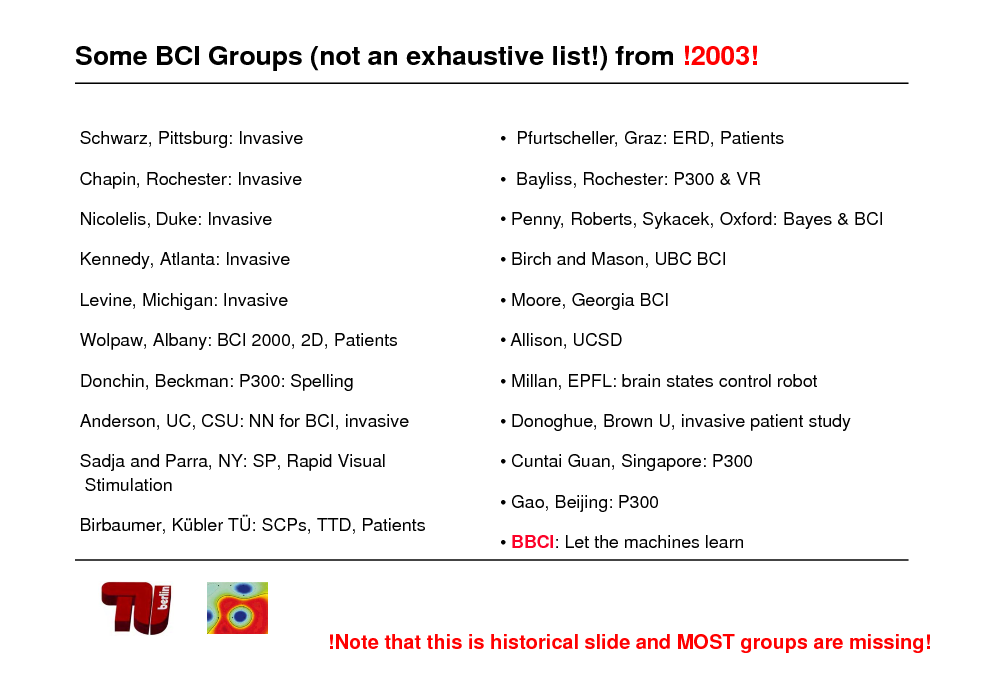
Some BCI Groups (not an exhaustive list!) from !2003!
Schwarz, Pittsburg: Invasive Chapin, Rochester: Invasive Pfurtscheller, Graz: ERD, Patients Bayliss, Rochester: P300 & VR
Nicolelis, Duke: Invasive
Kennedy, Atlanta: Invasive Levine, Michigan: Invasive
Penny, Roberts, Sykacek, Oxford: Bayes & BCI
Birch and Mason, UBC BCI Moore, Georgia BCI
Wolpaw, Albany: BCI 2000, 2D, Patients
Donchin, Beckman: P300: Spelling Anderson, UC, CSU: NN for BCI, invasive Sadja and Parra, NY: SP, Rapid Visual Stimulation Birbaumer, Kbler T: SCPs, TTD, Patients
Allison, UCSD
Millan, EPFL: brain states control robot Donoghue, Brown U, invasive patient study Cuntai Guan, Singapore: P300 Gao, Beijing: P300 BBCI: Let the machines learn
!Note that this is historical slide and MOST groups are missing!
3
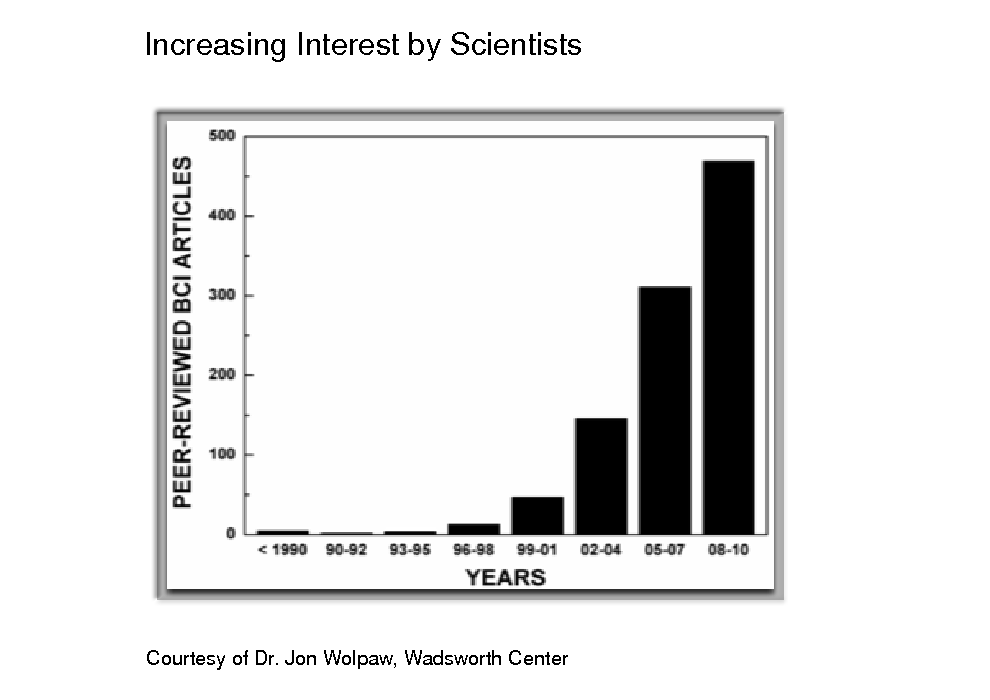
Increasing Interest by Scientists
Courtesy of Dr. Jon Wolpaw, Wadsworth Center
4
![Slide: The origins of EEG and MEG (short recap.)
EPSPs and IPSPs
[From Vigario]](https://yosinski.com/mlss12/media/slides/MLSS-2012-Muller-Brain-Computer-Interfacing_005.png)
The origins of EEG and MEG (short recap.)
EPSPs and IPSPs
[From Vigario]
5
![Slide: From single units to patch of dipoles
[From Vigario]](https://yosinski.com/mlss12/media/slides/MLSS-2012-Muller-Brain-Computer-Interfacing_006.png)
From single units to patch of dipoles
[From Vigario]
6
![Slide: From single units to patch of dipoles (cont.)
[From Vigario]](https://yosinski.com/mlss12/media/slides/MLSS-2012-Muller-Brain-Computer-Interfacing_007.png)
From single units to patch of dipoles (cont.)
[From Vigario]
7
![Slide: A glance at the cerebrum Motor cortex
[From Vigario]](https://yosinski.com/mlss12/media/slides/MLSS-2012-Muller-Brain-Computer-Interfacing_008.png)
A glance at the cerebrum Motor cortex
[From Vigario]
8
![Slide: From dipole patches to EEG
[From Vigario]](https://yosinski.com/mlss12/media/slides/MLSS-2012-Muller-Brain-Computer-Interfacing_009.png)
From dipole patches to EEG
[From Vigario]
9
![Slide: Invasive vs noninvasive Brain Computer Interfacing
[From Schalk]](https://yosinski.com/mlss12/media/slides/MLSS-2012-Muller-Brain-Computer-Interfacing_010.png)
Invasive vs noninvasive Brain Computer Interfacing
[From Schalk]
10
![Slide: Invasive BCI at its best
[From Schwartz]](https://yosinski.com/mlss12/media/slides/MLSS-2012-Muller-Brain-Computer-Interfacing_011.png)
Invasive BCI at its best
[From Schwartz]
11
![Slide: ECOG
presurgical localization of area causing epilepsy
excellent possibilty to learn about brain for human subject
[From Schalk]](https://yosinski.com/mlss12/media/slides/MLSS-2012-Muller-Brain-Computer-Interfacing_012.png)
ECOG
presurgical localization of area causing epilepsy
excellent possibilty to learn about brain for human subject
[From Schalk]
12
![Slide: Invasive vs noninvasive Brain Computer Interfacing
[From Birbaumer et al., Nicolelis et al]](https://yosinski.com/mlss12/media/slides/MLSS-2012-Muller-Brain-Computer-Interfacing_013.png)
Invasive vs noninvasive Brain Computer Interfacing
[From Birbaumer et al., Nicolelis et al]
13
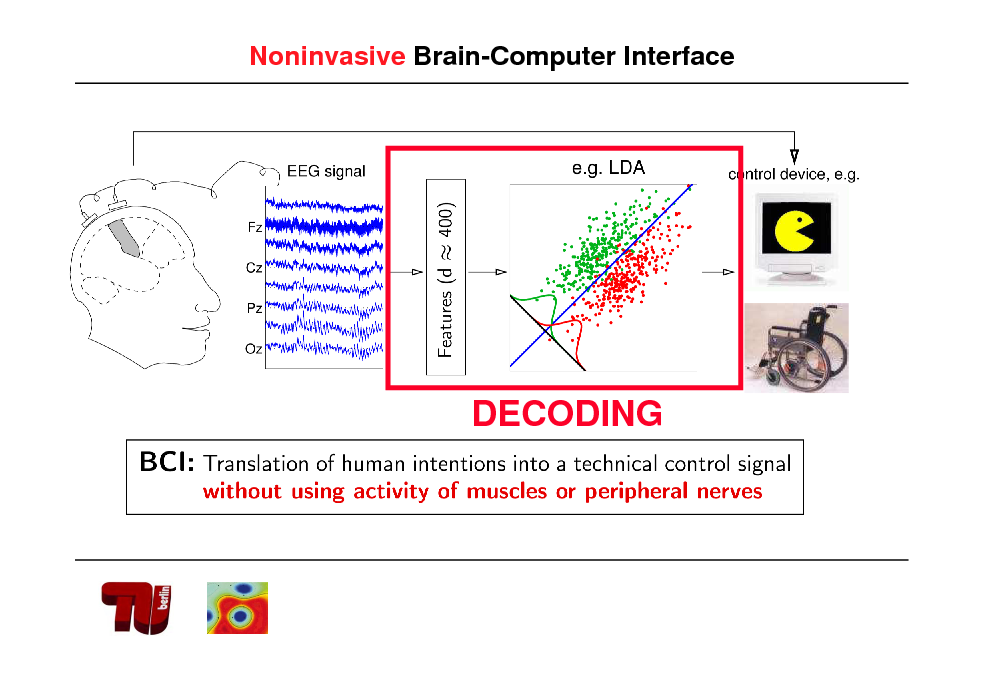
Noninvasive Brain-Computer Interface
DECODING
14
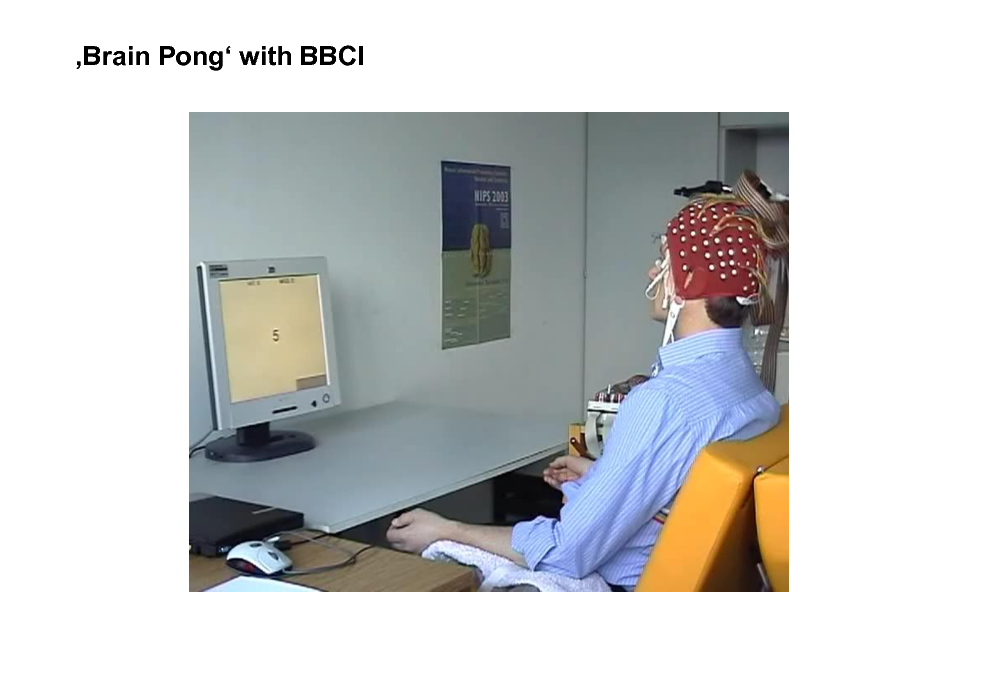
Brain Pong with BBCI
15
![Slide: Noninvasive BCI: clinical applications
Brain- Computer Interface
Signal Processing
EEG Acquisition Application Interface
FES Device Grasp-Pattern 3 channel Stimulation
[From Birbaumer et al.]
[From Pfurtscheller et al.]
BBCI: Leitmotiv: let the machines learn](https://yosinski.com/mlss12/media/slides/MLSS-2012-Muller-Brain-Computer-Interfacing_016.png)
Noninvasive BCI: clinical applications
Brain- Computer Interface
Signal Processing
EEG Acquisition Application Interface
FES Device Grasp-Pattern 3 channel Stimulation
[From Birbaumer et al.]
[From Pfurtscheller et al.]
BBCI: Leitmotiv: let the machines learn
16
![Slide: The cerebral cocktail party problem
use ICA/NGCA projections for artifact and noise removal feature extraction and selection
[cf. Ziehe et al. 2000, Blanchard et al. 2006]](https://yosinski.com/mlss12/media/slides/MLSS-2012-Muller-Brain-Computer-Interfacing_017.png)
The cerebral cocktail party problem
use ICA/NGCA projections for artifact and noise removal feature extraction and selection
[cf. Ziehe et al. 2000, Blanchard et al. 2006]
17
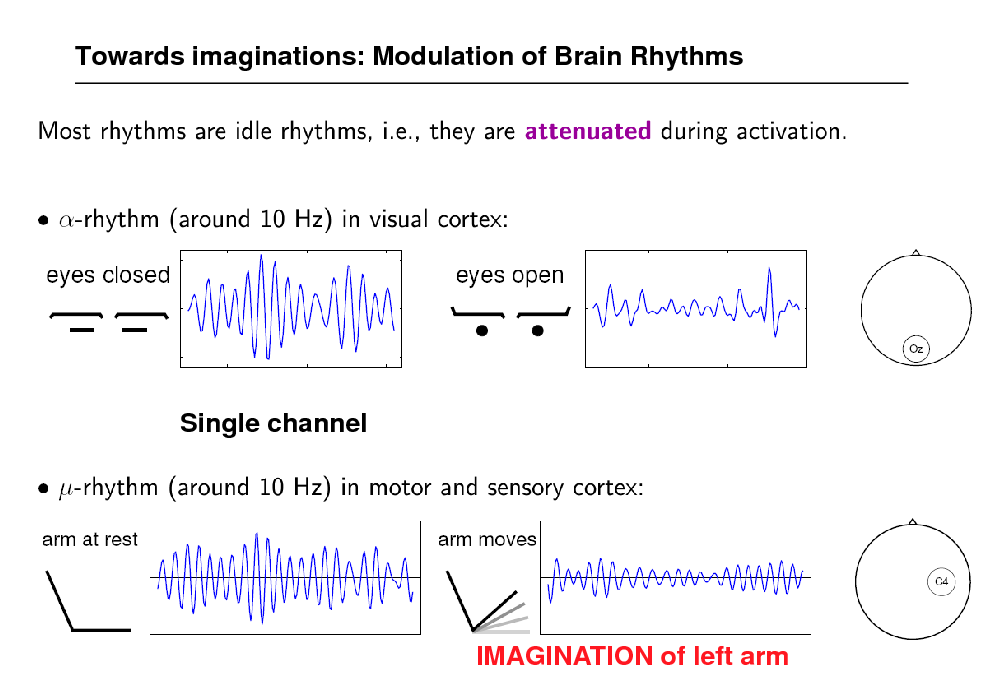
Towards imaginations: Modulation of Brain Rhythms
Single channel
IMAGINATION of left arm
18
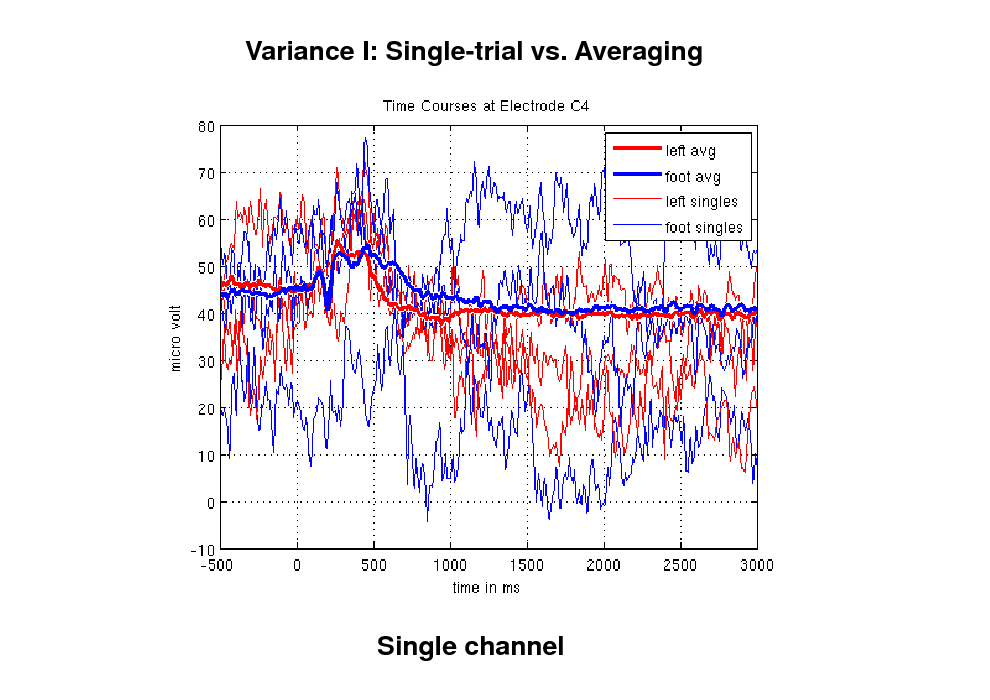
Variance I: Single-trial vs. Averaging
Single channel
19
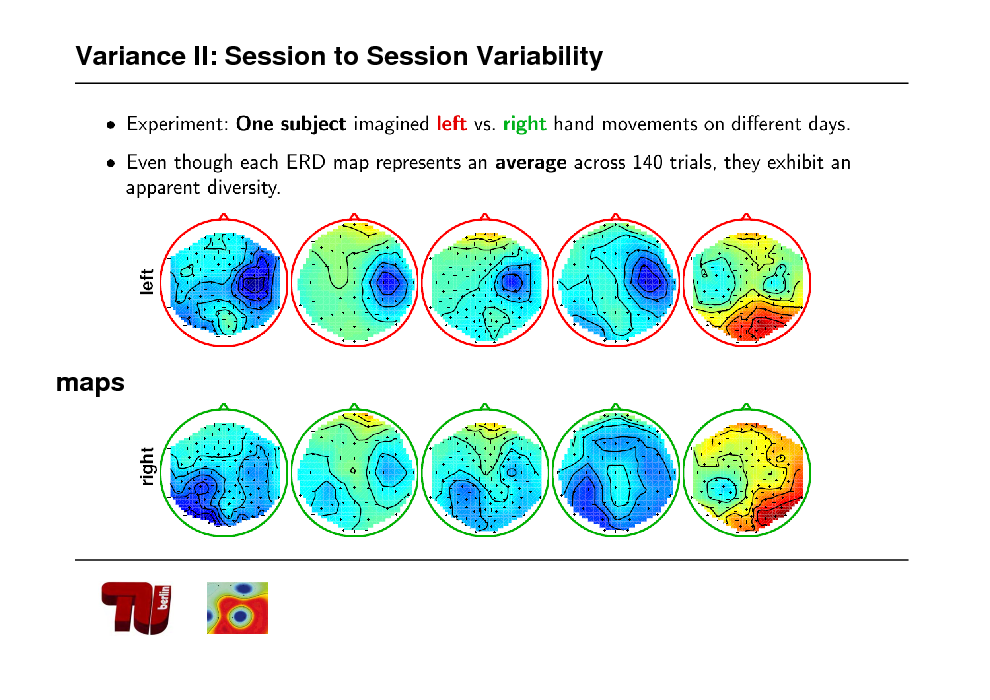
Variance II: Session to Session Variability
maps
20
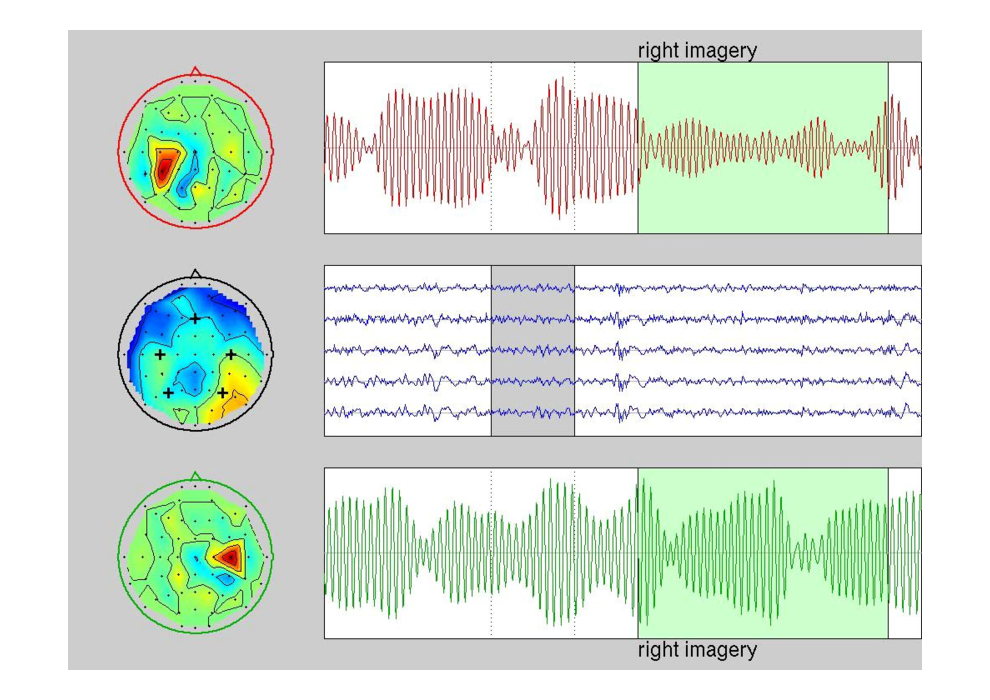
![Slide: Variance III: inter subject variability [l vs r]](https://yosinski.com/mlss12/media/slides/MLSS-2012-Muller-Brain-Computer-Interfacing_021.png)
Variance III: inter subject variability [l vs r]
21
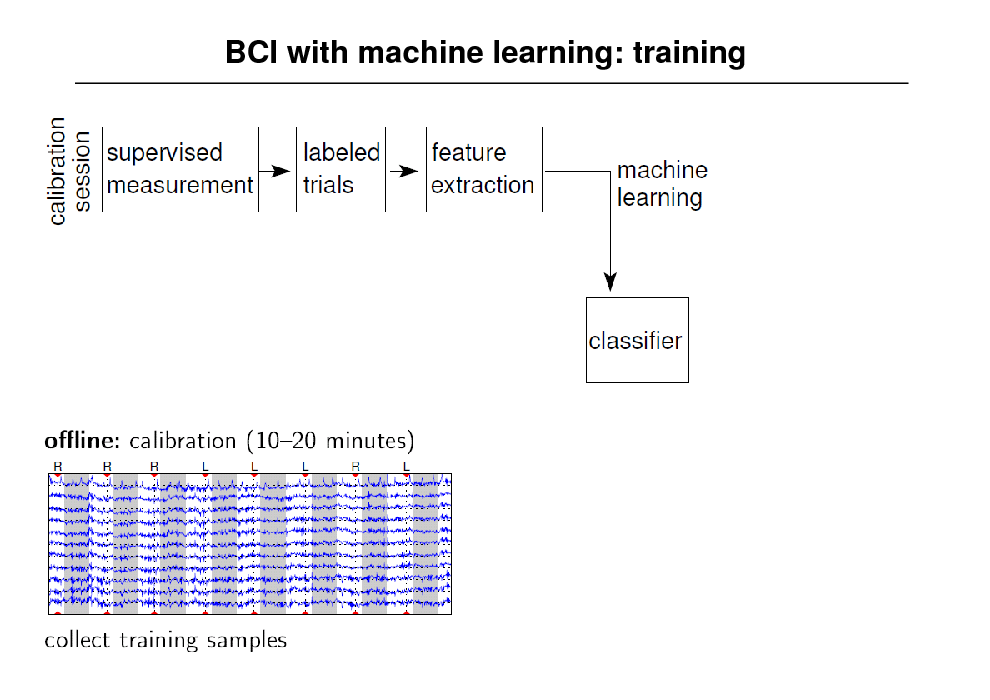
BCI with machine learning: training
22
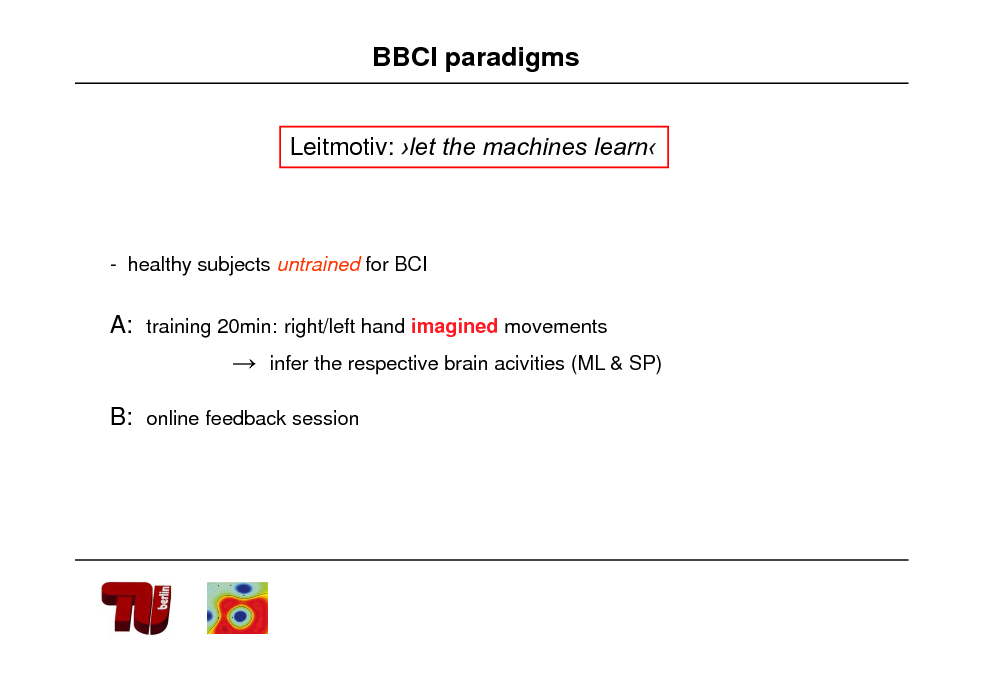
BBCI paradigms
Leitmotiv: let the machines learn
- healthy subjects untrained for BCI
A: training 20min: right/left hand imagined movements infer the respective brain acivities (ML & SP)
B: online feedback session
23
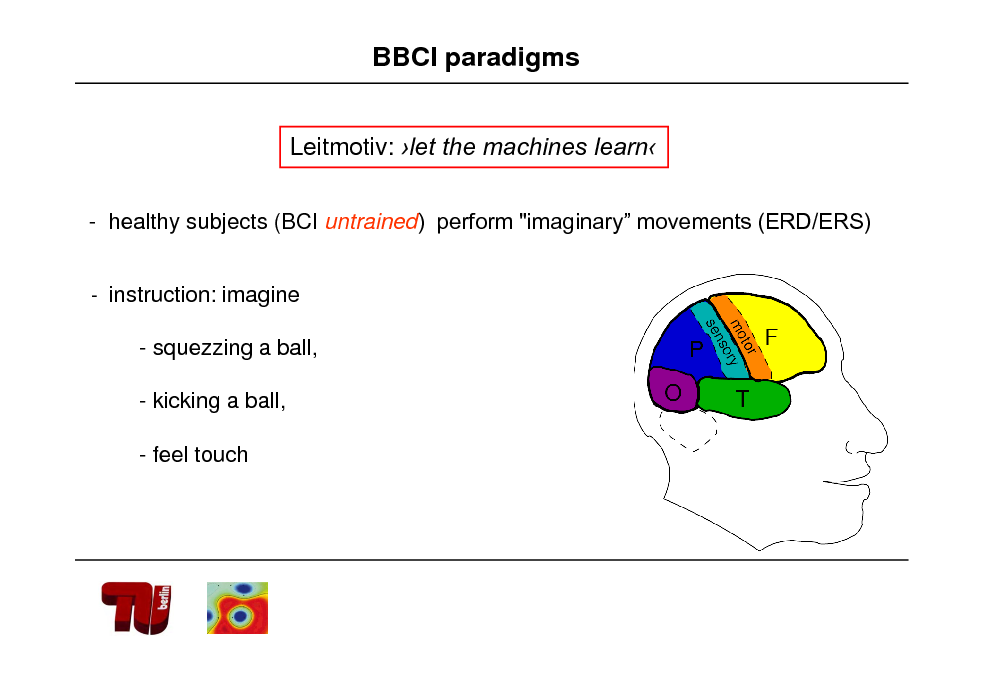
BBCI paradigms
Leitmotiv: let the machines learn
- healthy subjects (BCI untrained) perform "imaginary movements (ERD/ERS)
- instruction: imagine
- squezzing a ball, - kicking a ball, - feel touch
24
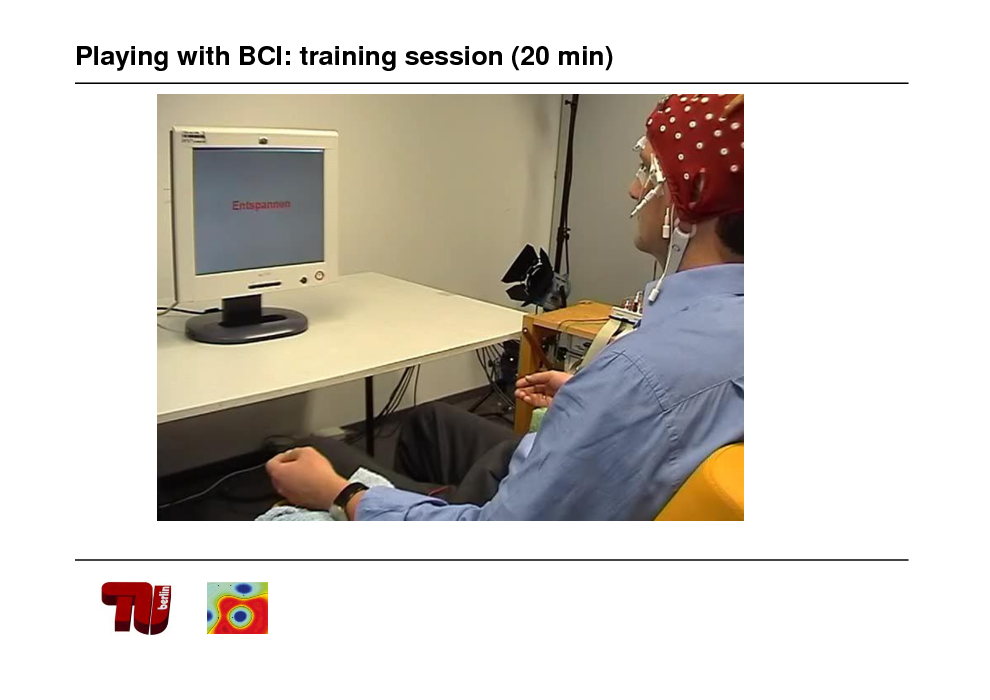
Playing with BCI: training session (20 min)
25
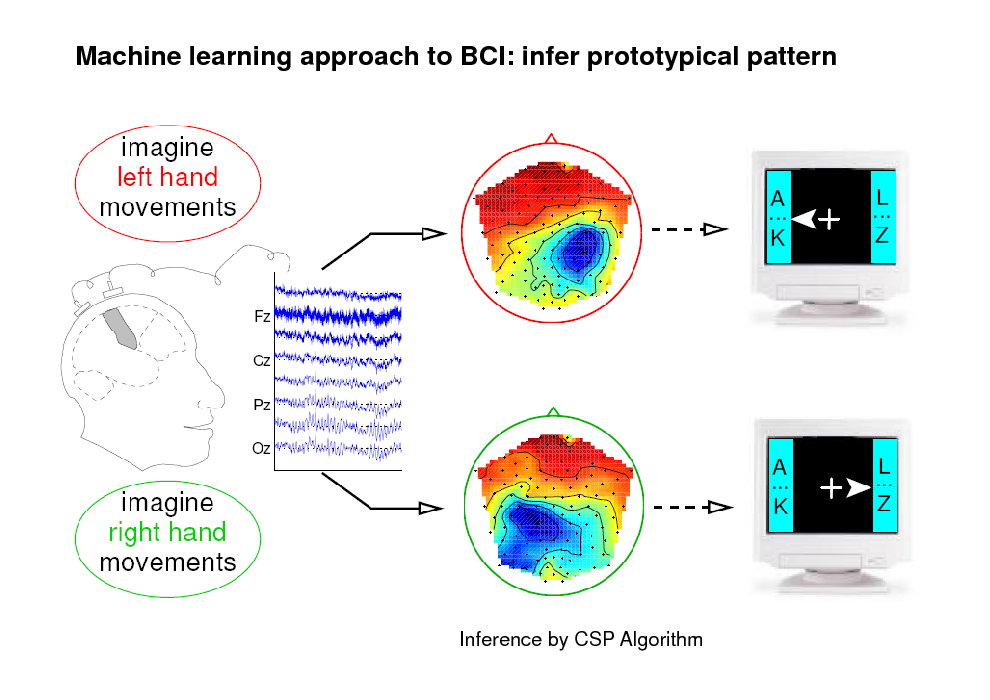
Machine learning approach to BCI: infer prototypical pattern
Inference by CSP Algorithm
26
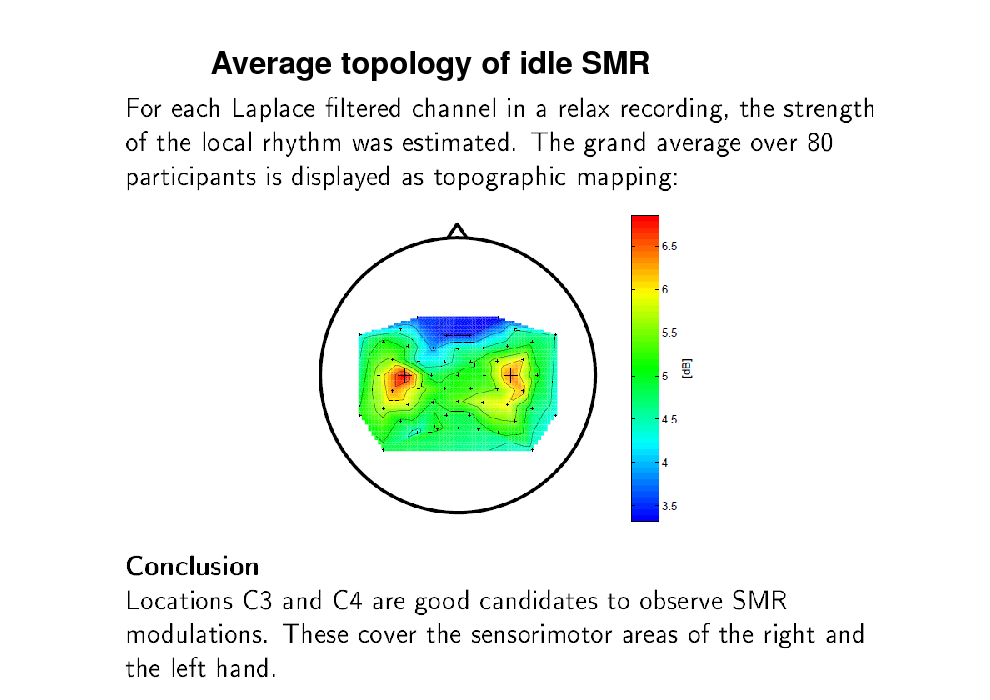
Average topology of idle SMR
27
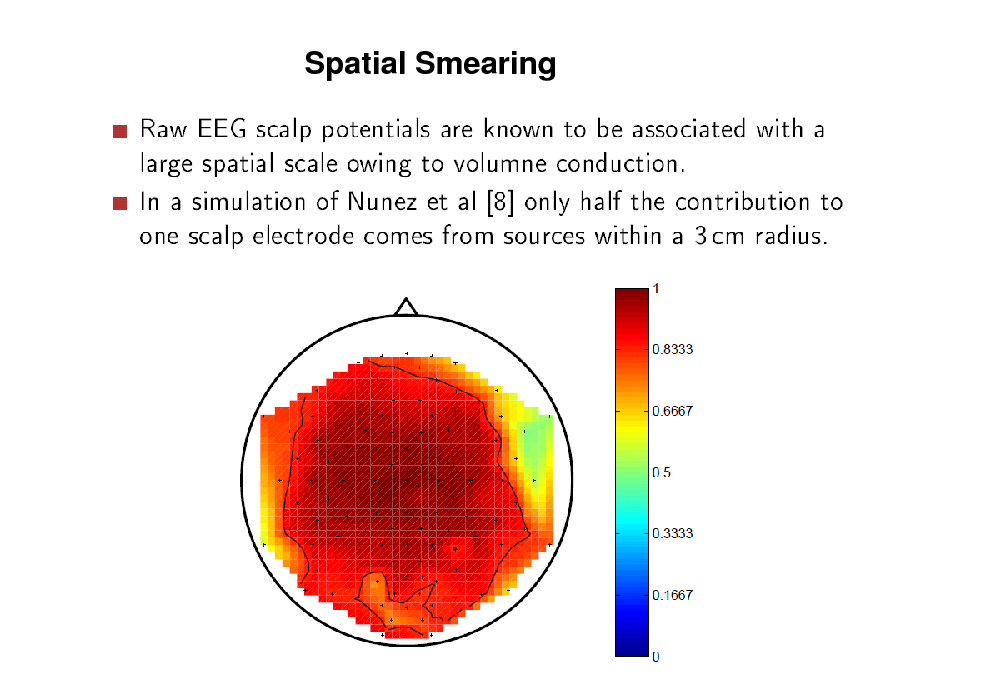
Spatial Smearing
28
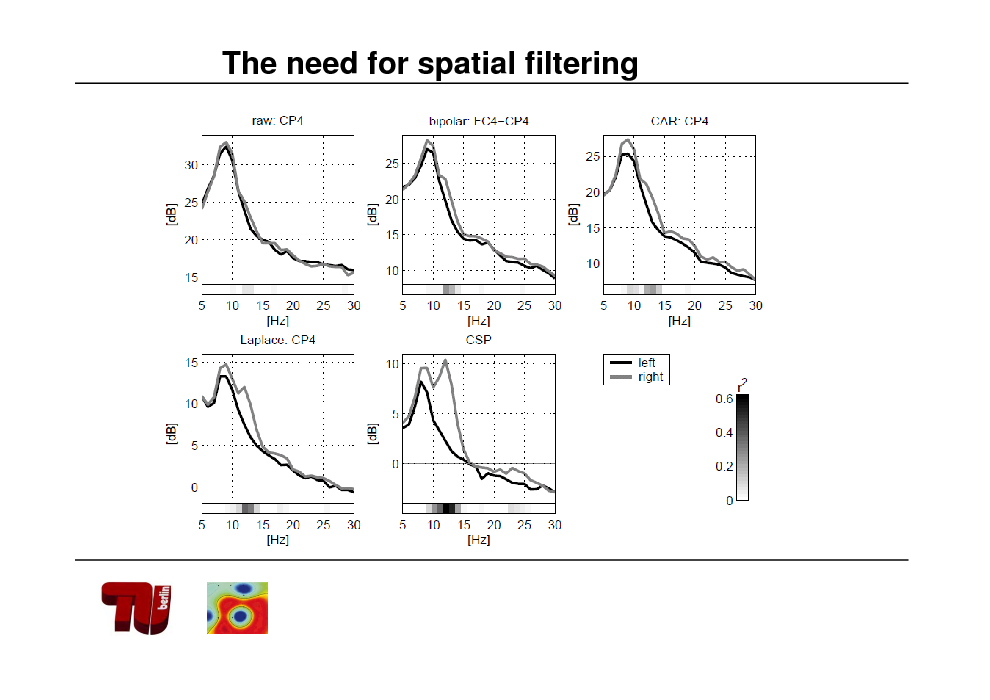
The need for spatial filtering
29
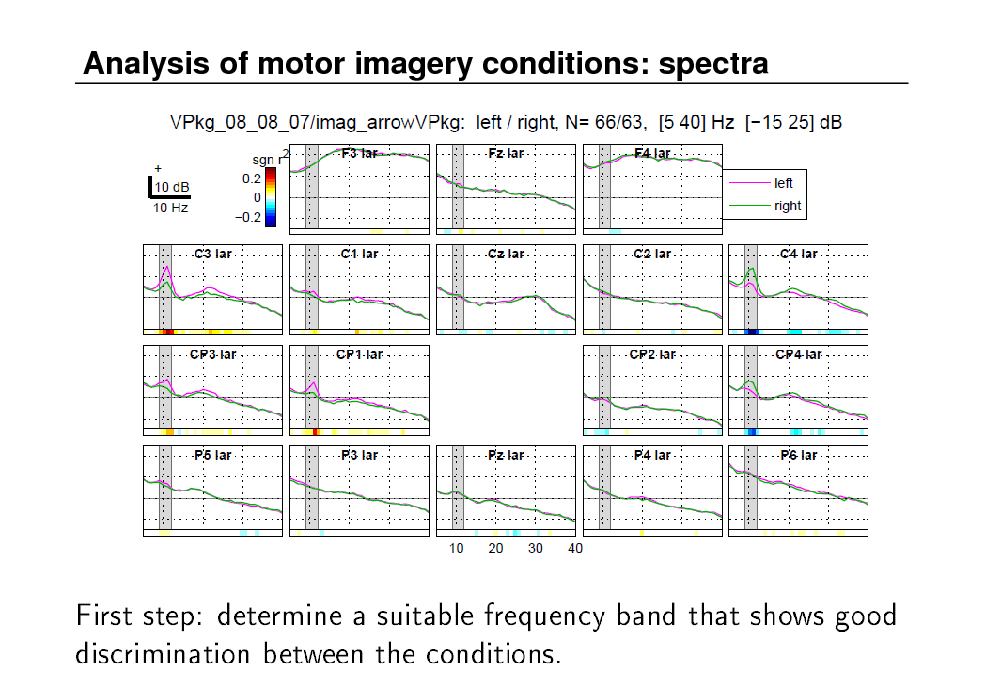
Analysis of motor imagery conditions: spectra
30
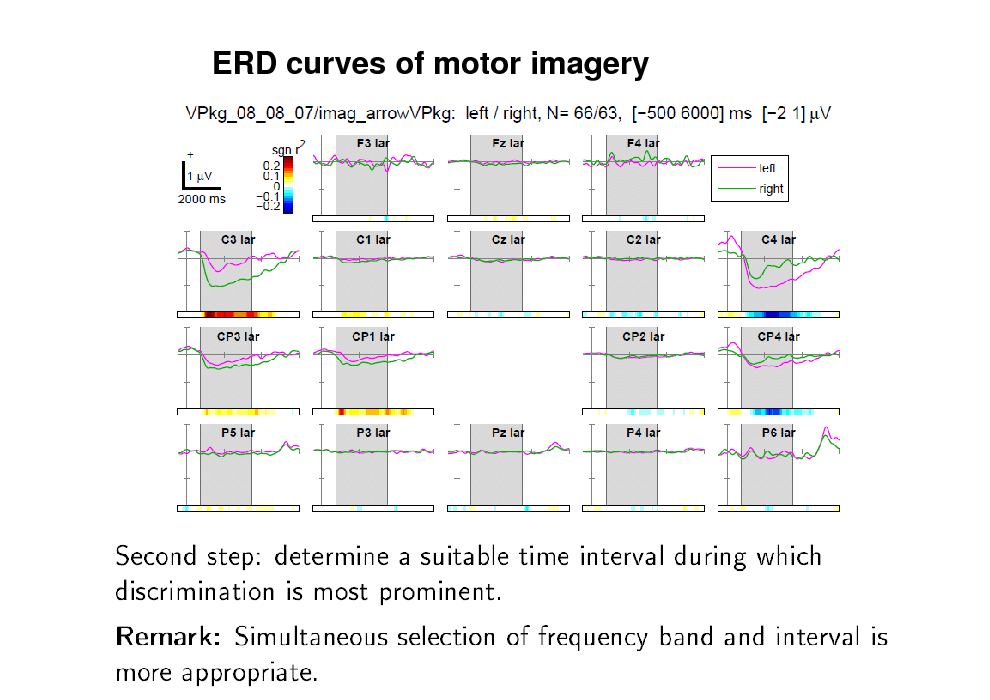
ERD curves of motor imagery
31
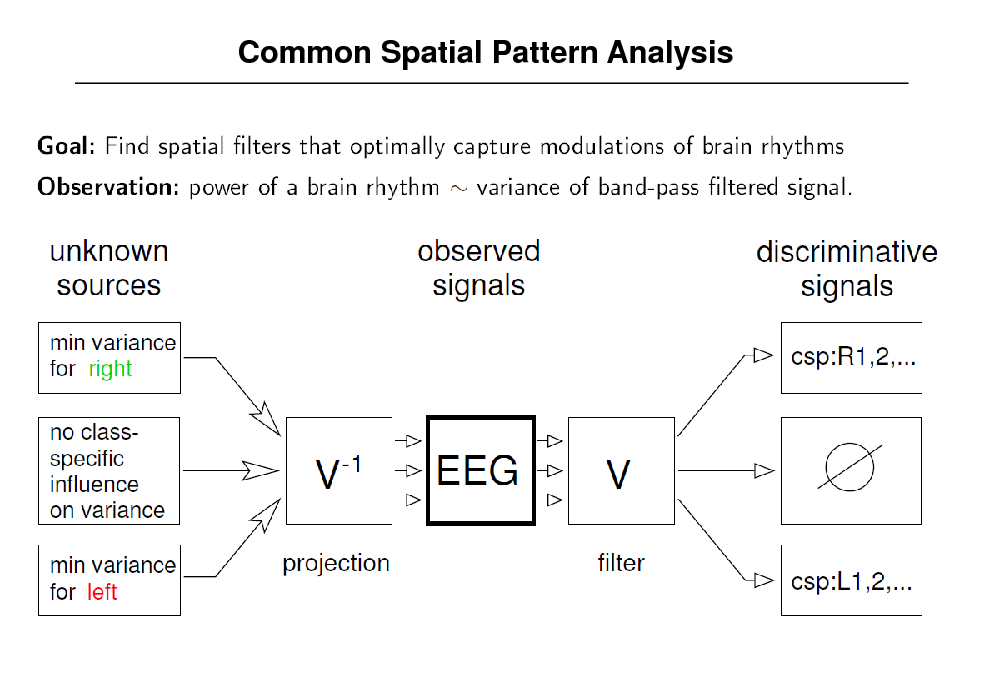
Common Spatial Pattern Analysis
32
![Slide: Common Spatial Patterns for 2 classes
[cf. Blankertz et al. 2008, Lemm et al. 2005, Dornhege et al. 2006, Tomioka & Mller 2010]](https://yosinski.com/mlss12/media/slides/MLSS-2012-Muller-Brain-Computer-Interfacing_033.png)
Common Spatial Patterns for 2 classes
[cf. Blankertz et al. 2008, Lemm et al. 2005, Dornhege et al. 2006, Tomioka & Mller 2010]
33
CSP at work
34
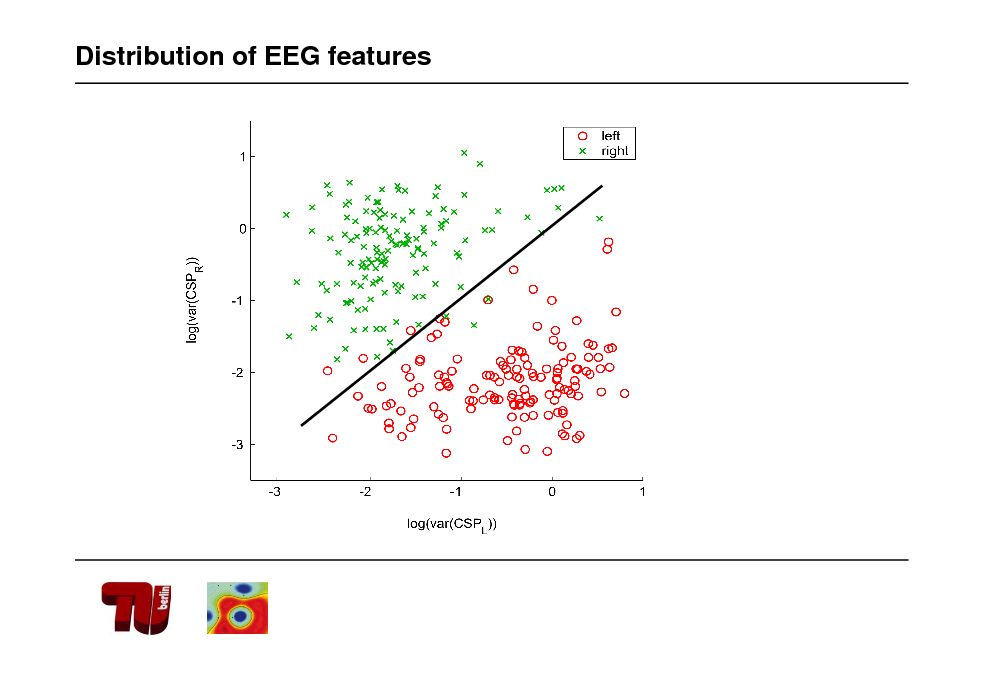
Distribution of EEG features
35
![Slide: BBCI Set-up
Artifact removal
[cf. Mller et al. 2001, 2007, 2008, Dornhege et al. 2003, 2007, Blankertz et al. 2004, 2005, 2006, 2007, 2008]](https://yosinski.com/mlss12/media/slides/MLSS-2012-Muller-Brain-Computer-Interfacing_036.png)
BBCI Set-up
Artifact removal
[cf. Mller et al. 2001, 2007, 2008, Dornhege et al. 2003, 2007, Blankertz et al. 2004, 2005, 2006, 2007, 2008]
36
![Slide: What can Machine Learning tell us about physiology?
1
1
[cf. Blankertz et al. 2001, 2006]](https://yosinski.com/mlss12/media/slides/MLSS-2012-Muller-Brain-Computer-Interfacing_037.png)
What can Machine Learning tell us about physiology?
1
1
[cf. Blankertz et al. 2001, 2006]
37
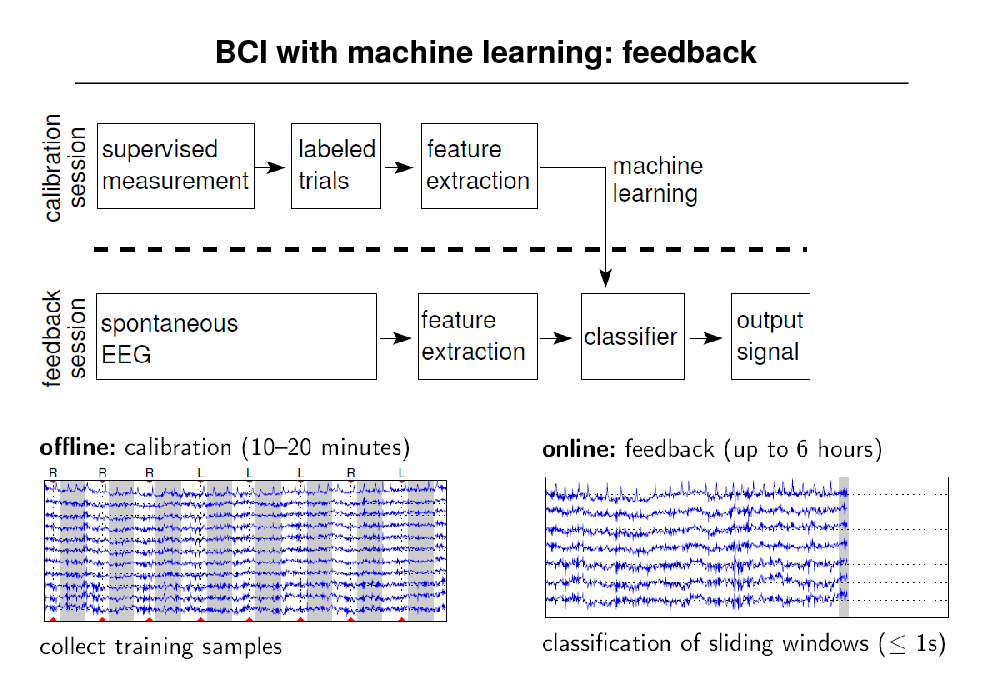
BCI with machine learning: feedback
38
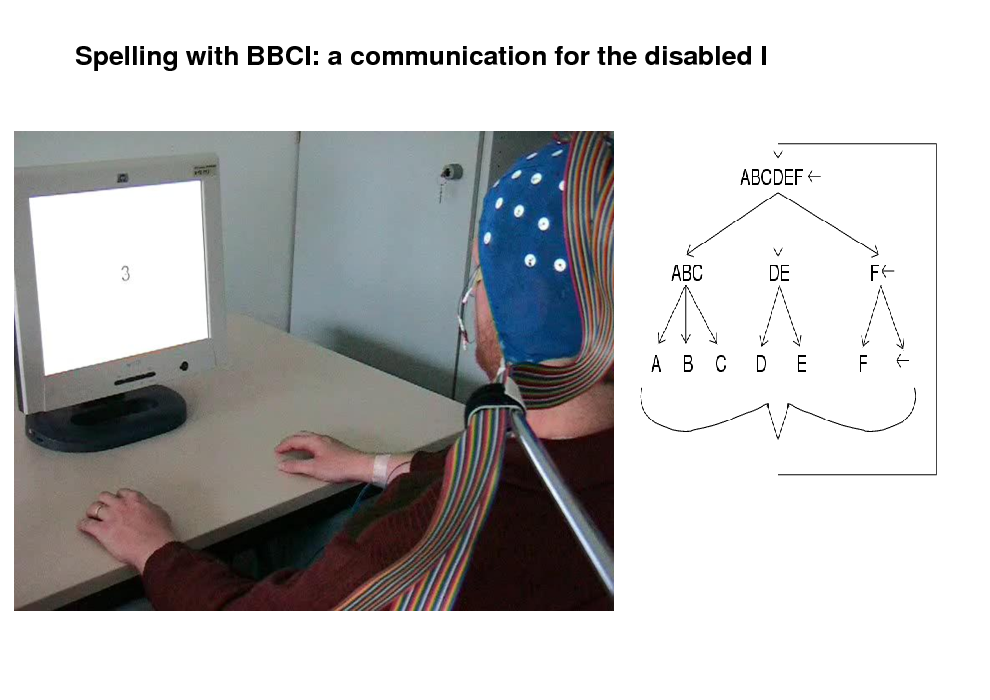
Spelling with BBCI: a communication for the disabled I
39
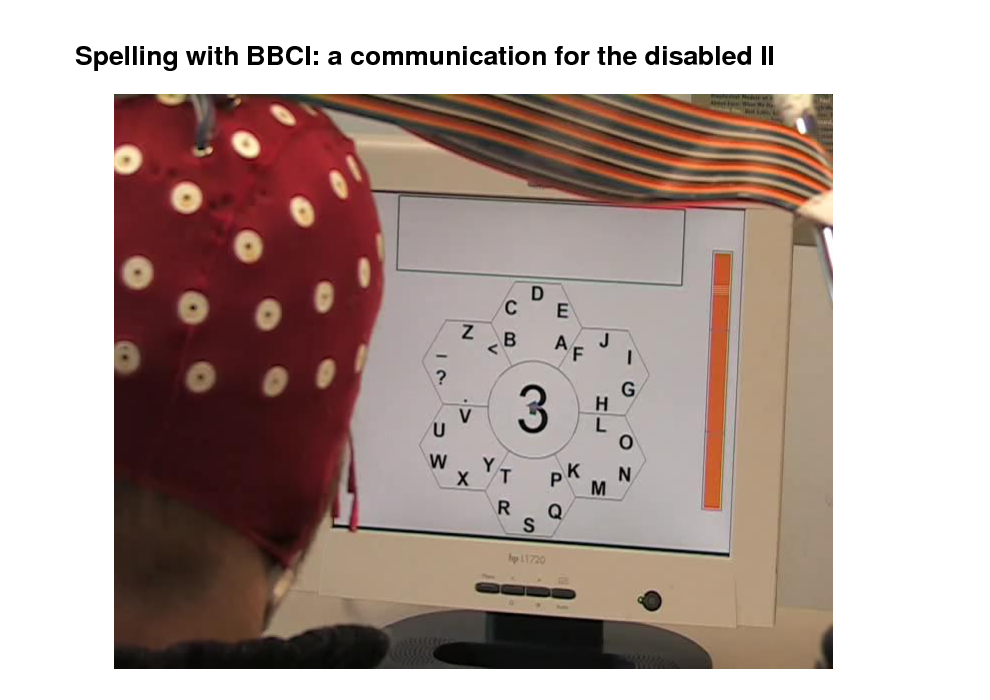
Spelling with BBCI: a communication for the disabled II
40

Variance IV: Shifting distributions within experiment
41
![Slide: Interlude: Caveats in Validation
[cf. Blankertz et al 2011]](https://yosinski.com/mlss12/media/slides/MLSS-2012-Muller-Brain-Computer-Interfacing_042.png)
Interlude: Caveats in Validation
[cf. Blankertz et al 2011]
42
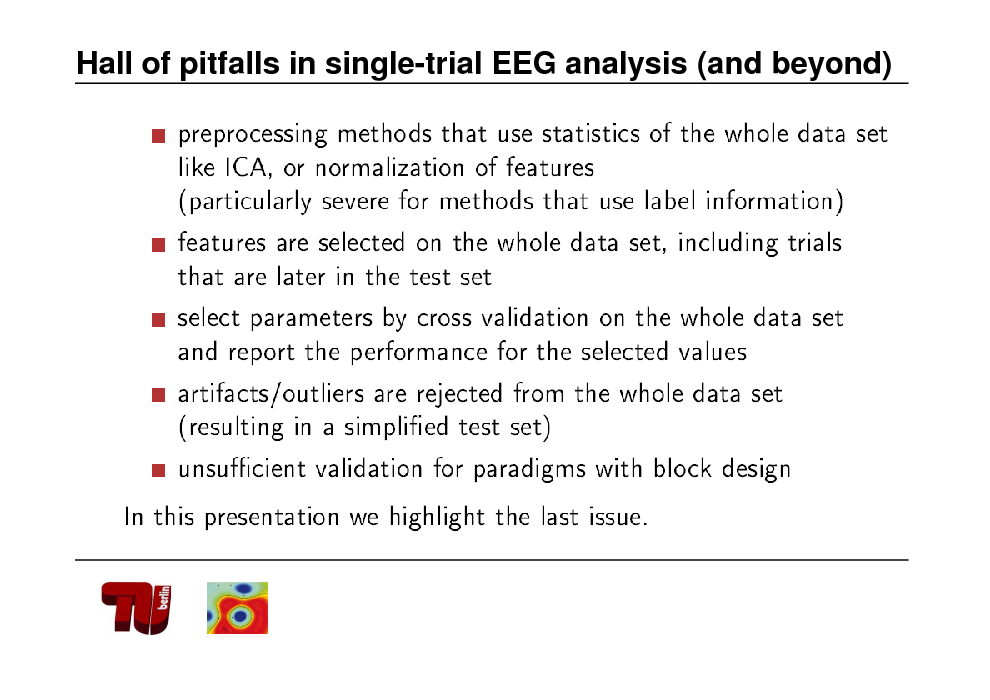
Hall of pitfalls in single-trial EEG analysis (and beyond)
43
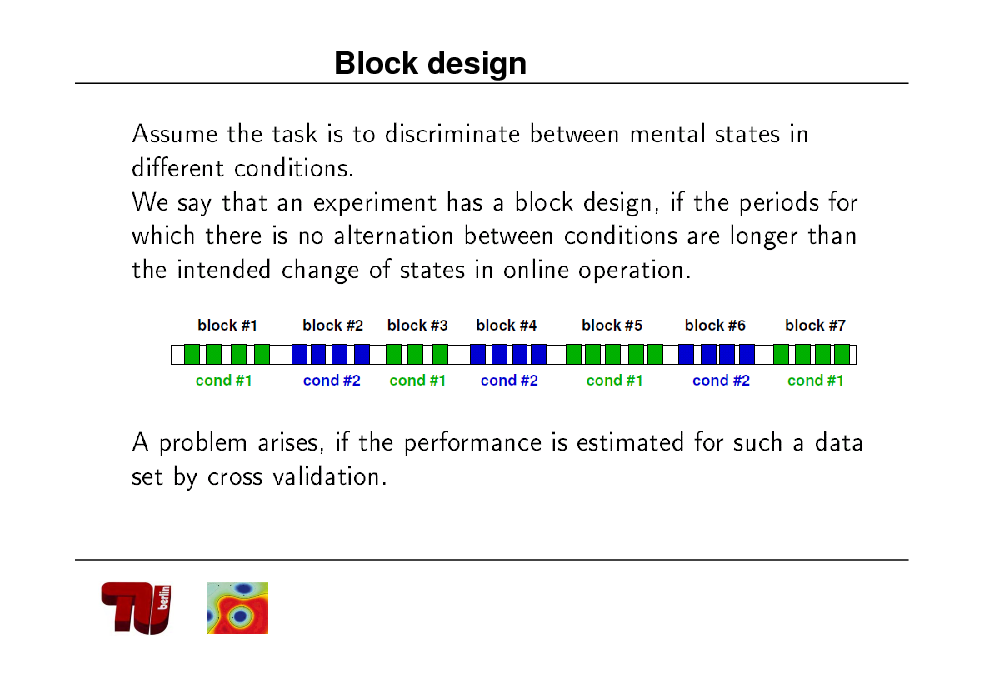
Block design
44
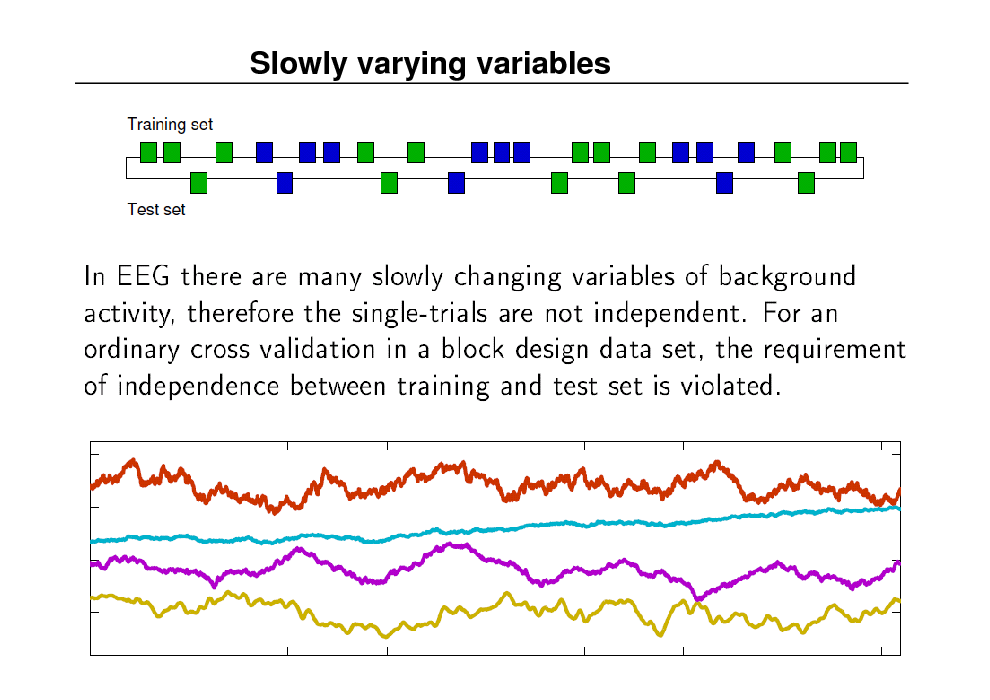
Slowly varying variables
45
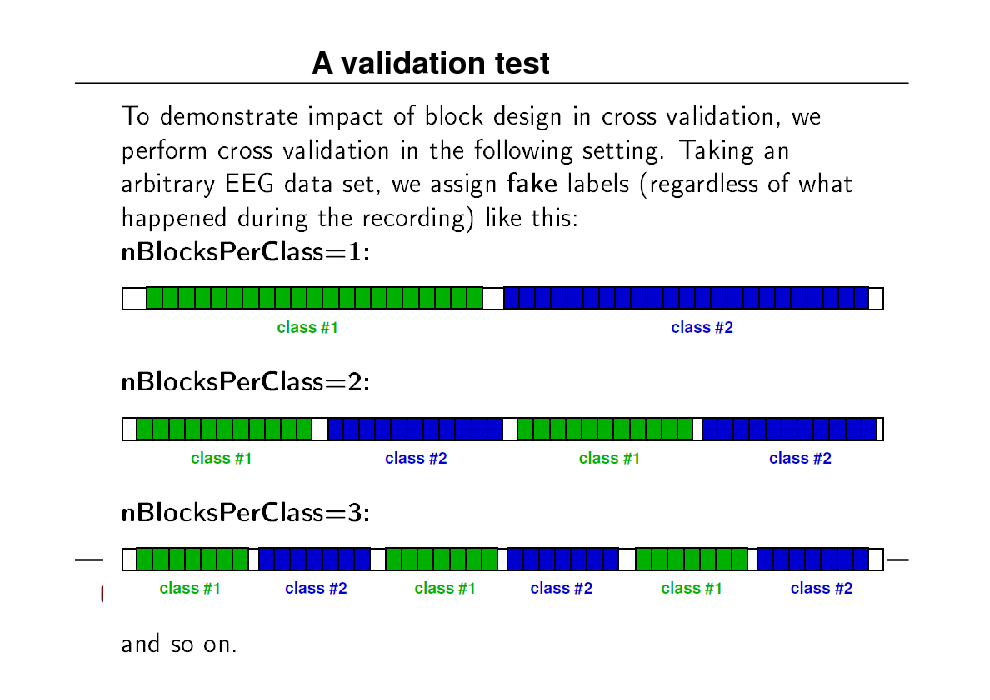
A validation test
46
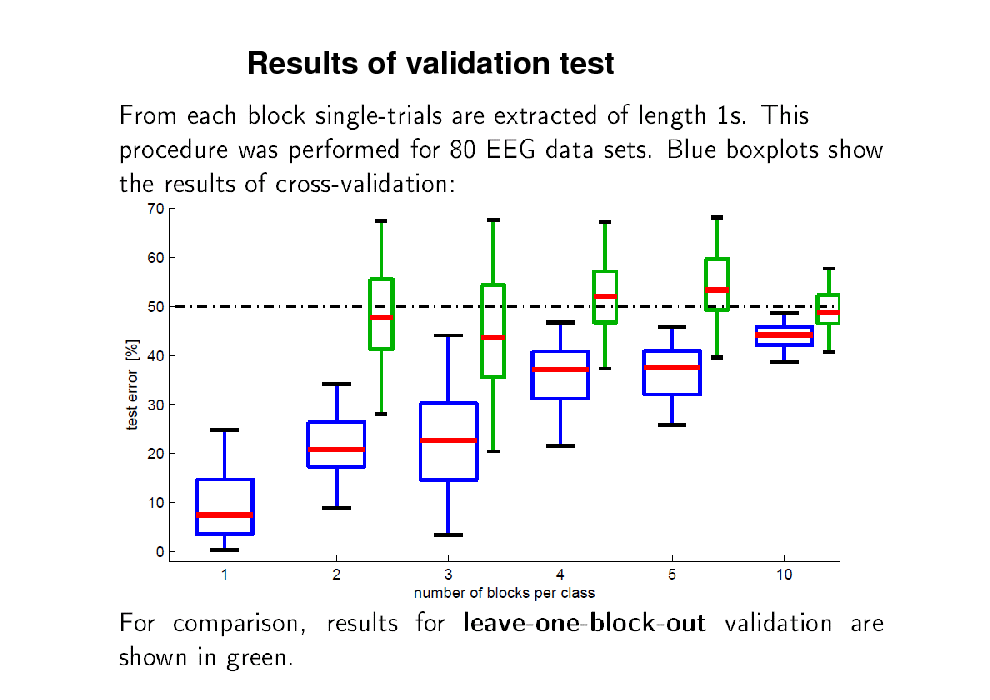
Results of validation test
47
Further remarks & summary
48
Part II ML challenges
Aleviating non-stationarity Multimodal sources
49
![Slide: Recap: BBCI Set-up
Artifact removal
[cf. Mller et al. 2001, 2007, 2008, Dornhege et al. 2003, 2007, Blankertz et al. 2004, 2005, 2006, 2007, 2008]](https://yosinski.com/mlss12/media/slides/MLSS-2012-Muller-Brain-Computer-Interfacing_050.png)
Recap: BBCI Set-up
Artifact removal
[cf. Mller et al. 2001, 2007, 2008, Dornhege et al. 2003, 2007, Blankertz et al. 2004, 2005, 2006, 2007, 2008]
50

Nonstationarity in BCI
51
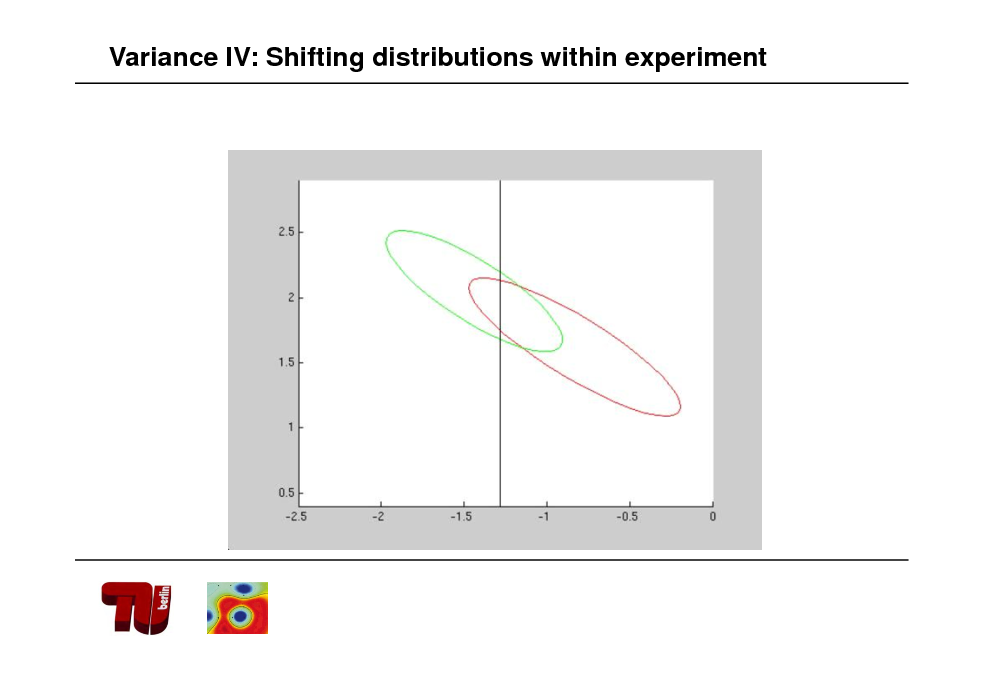
Variance IV: Shifting distributions within experiment
52
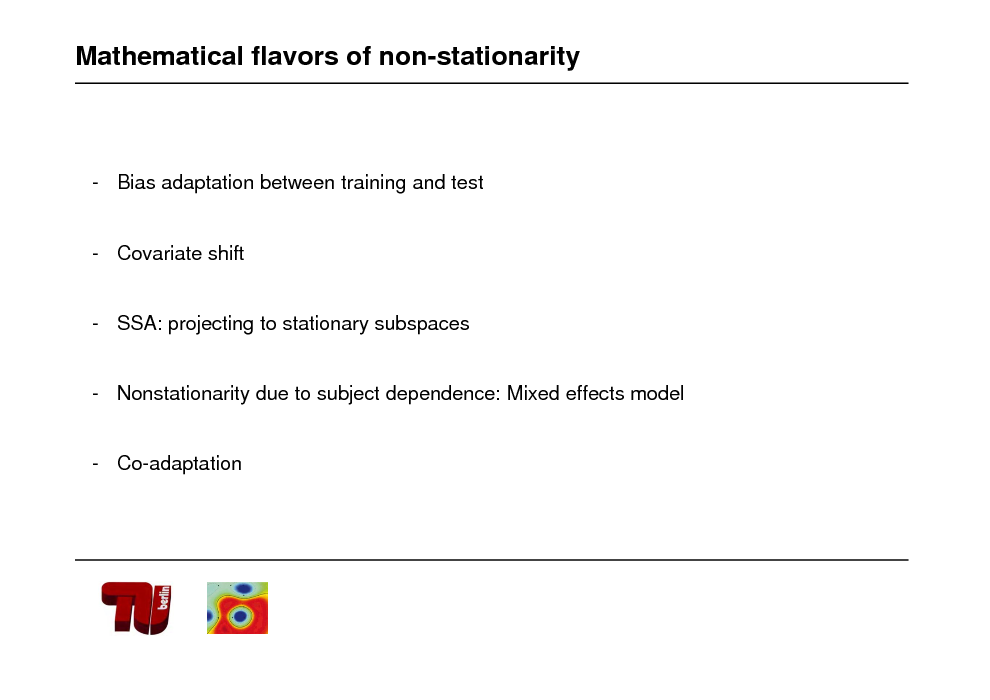
Mathematical flavors of non-stationarity
- Bias adaptation between training and test
- Covariate shift
- SSA: projecting to stationary subspaces
- Nonstationarity due to subject dependence: Mixed effects model
- Co-adaptation
53
![Slide: Neurophysiological analysis
[cf. Krauledat et al. 07]](https://yosinski.com/mlss12/media/slides/MLSS-2012-Muller-Brain-Computer-Interfacing_054.png)
Neurophysiological analysis
[cf. Krauledat et al. 07]
54
![Slide: Weighted Linear Regression for covariate shift compensation
, choosing
yields unbiased estimator even under covariate shift
[cf. Sugiyama & Mller 2005, Sugiyama et al. JMLR 2007, see next week MLSS12]](https://yosinski.com/mlss12/media/slides/MLSS-2012-Muller-Brain-Computer-Interfacing_055.png)
Weighted Linear Regression for covariate shift compensation
, choosing
yields unbiased estimator even under covariate shift
[cf. Sugiyama & Mller 2005, Sugiyama et al. JMLR 2007, see next week MLSS12]
55
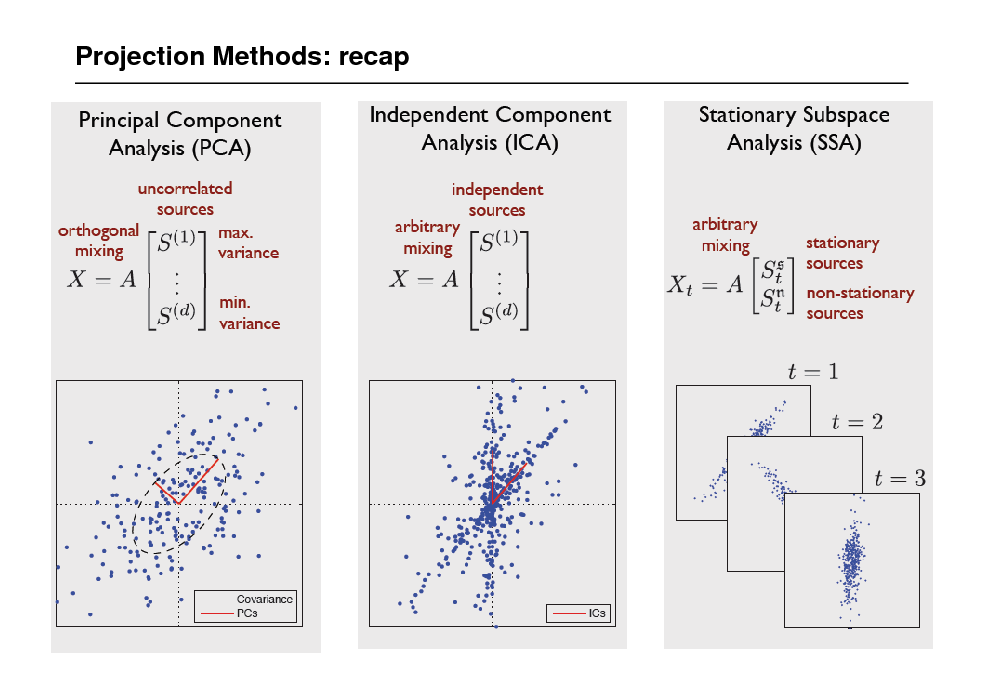
Projection Methods: recap
56
![Slide: Splitting into stationary and nonstationary subspace: SSA
invert
[cf. Bnau, Meinecke, Kiraly, Mller PRL 09]](https://yosinski.com/mlss12/media/slides/MLSS-2012-Muller-Brain-Computer-Interfacing_057.png)
Splitting into stationary and nonstationary subspace: SSA
invert
[cf. Bnau, Meinecke, Kiraly, Mller PRL 09]
57
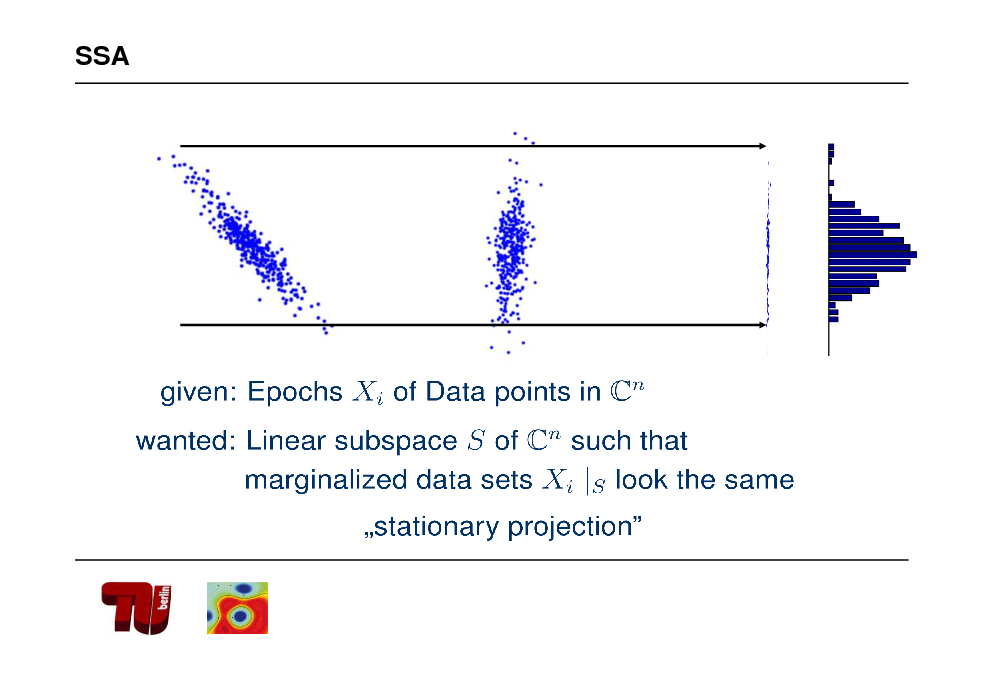
SSA
58
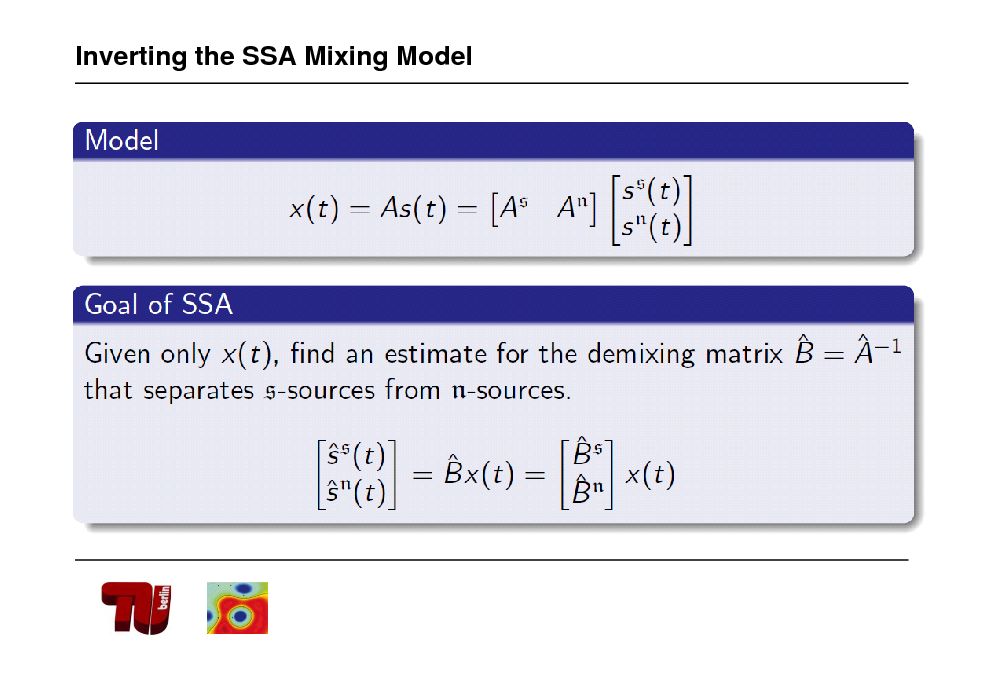
Inverting the SSA Mixing Model
59
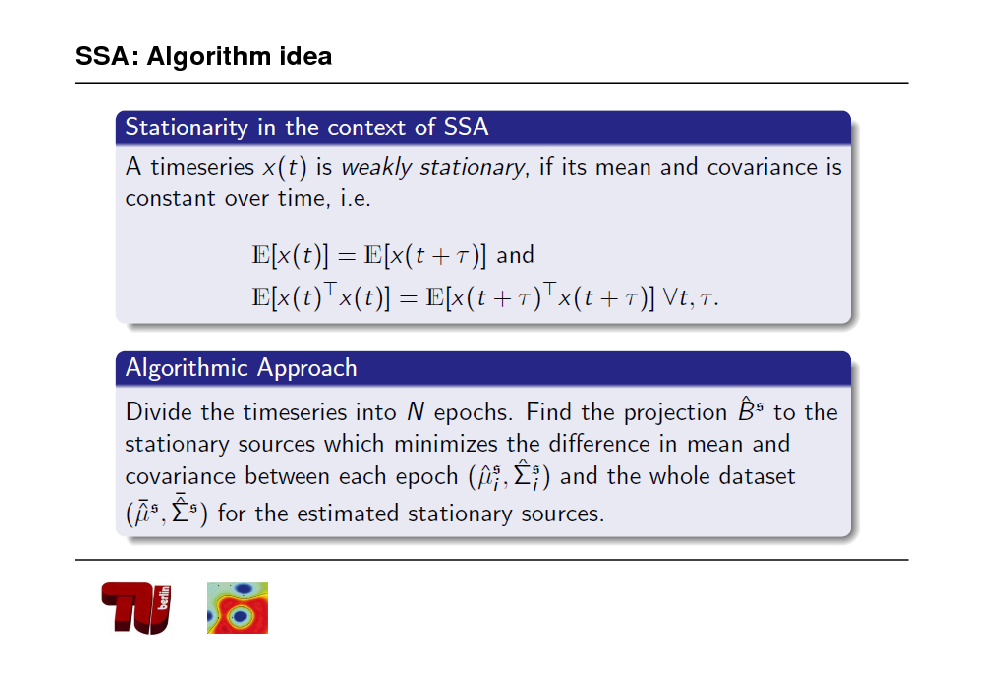
SSA: Algorithm idea
60
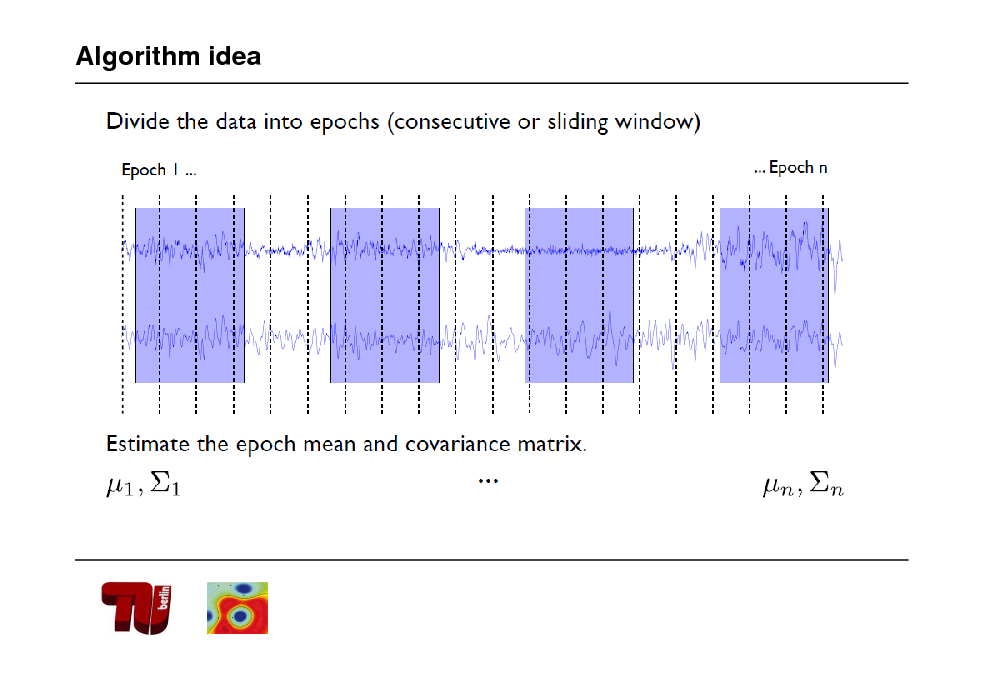
Algorithm idea
61
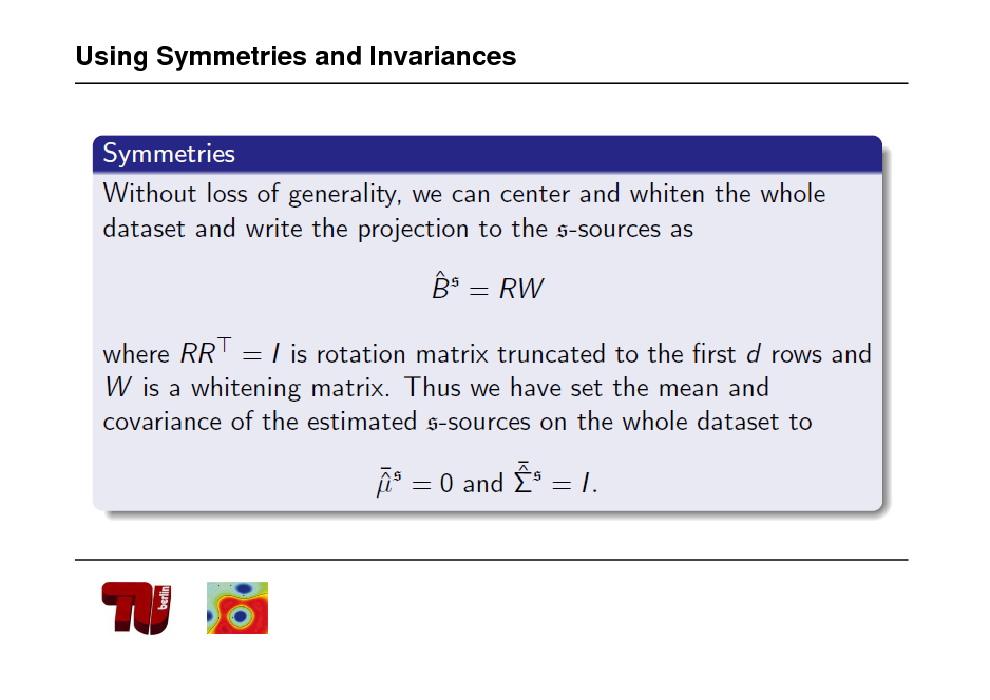
Using Symmetries and Invariances
62
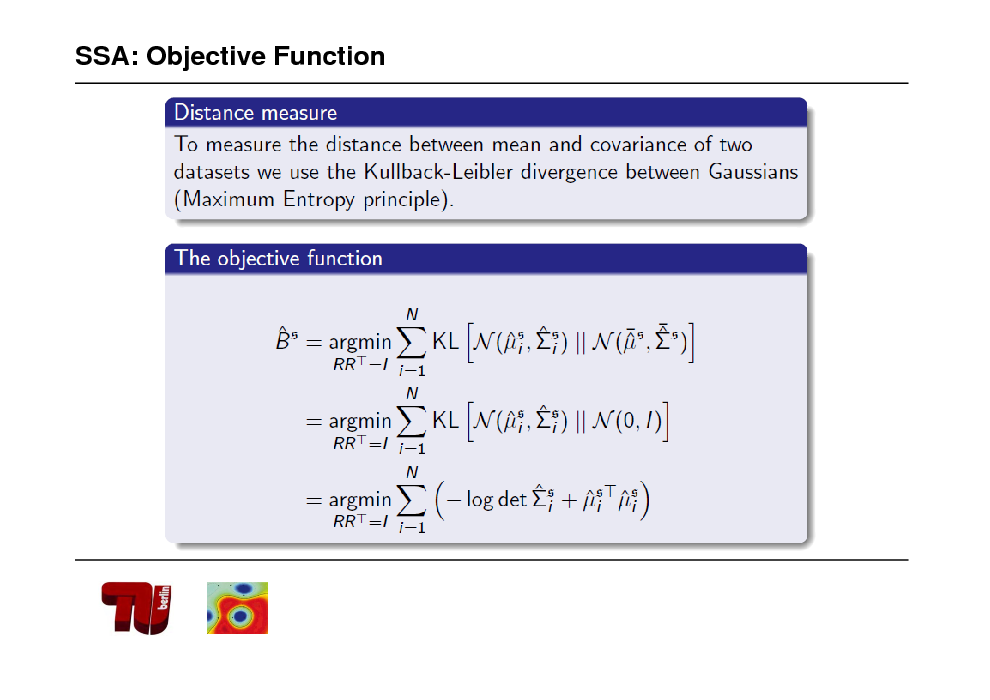
SSA: Objective Function
63
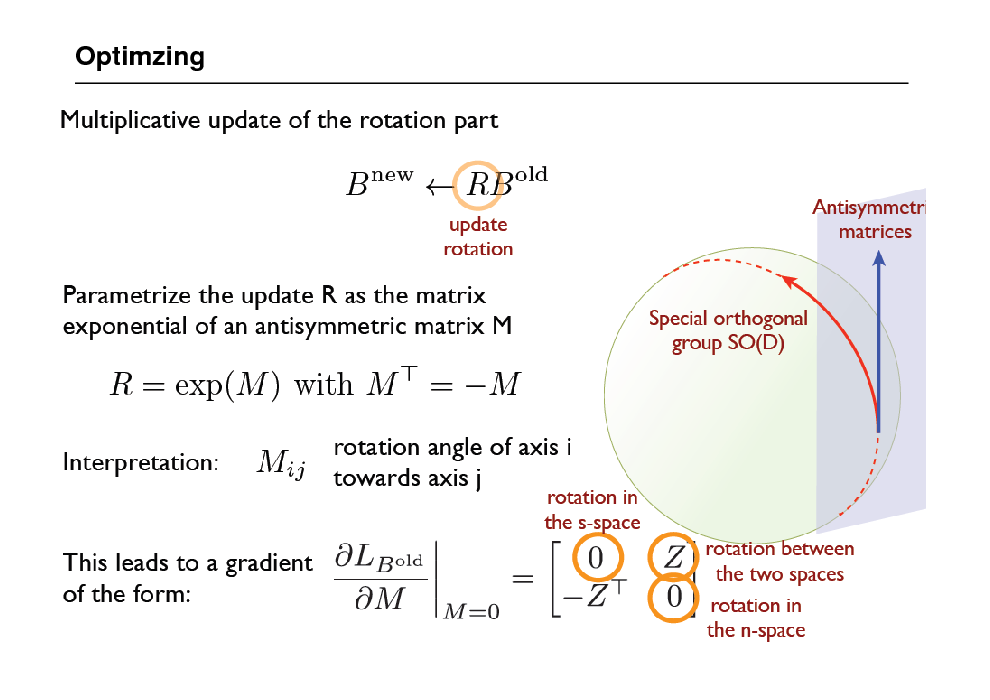
Optimzing
64

Spurious stationarity
65
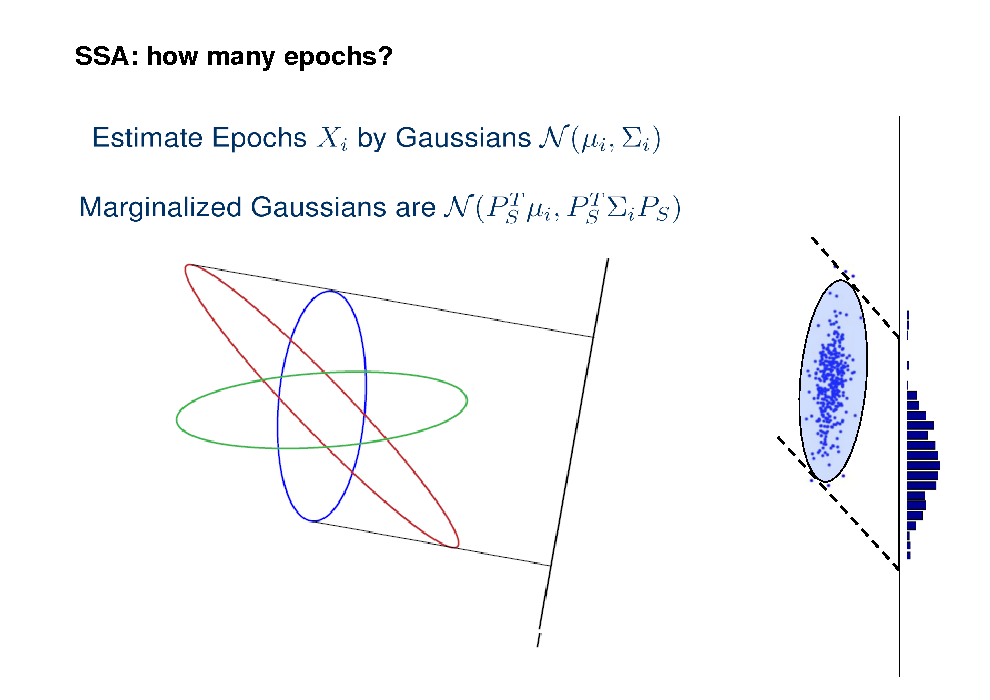
SSA: how many epochs?
66
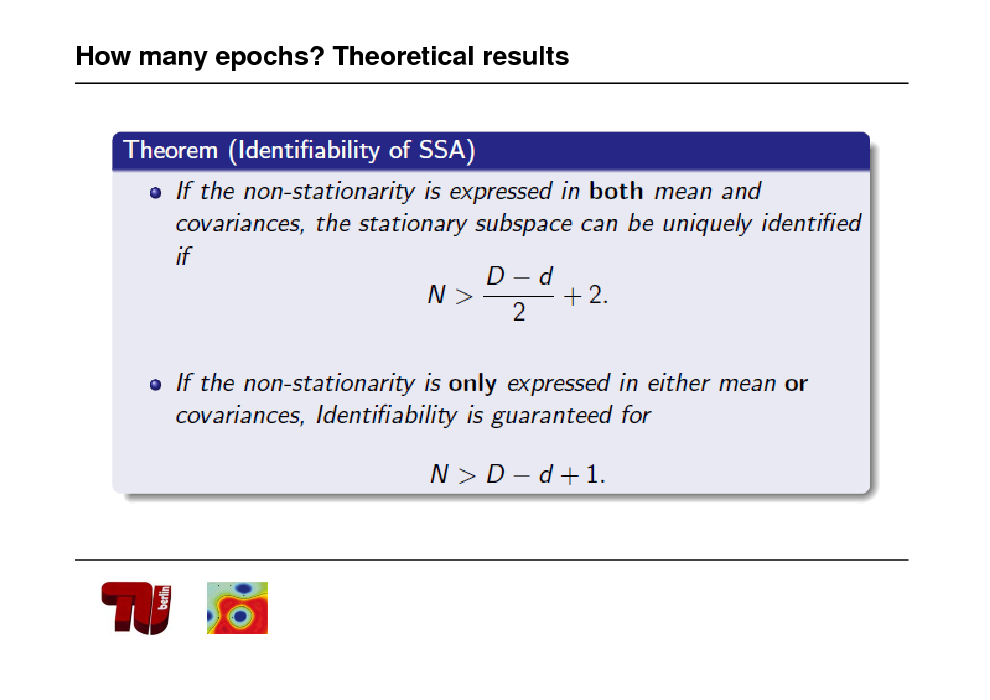
How many epochs? Theoretical results
67
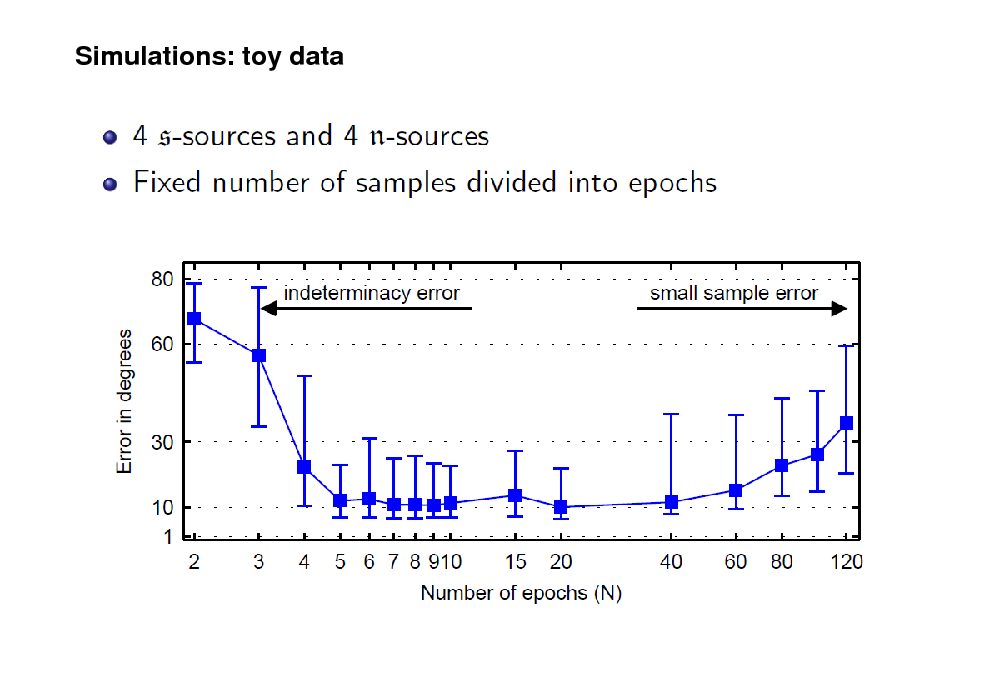
Simulations: toy data
68
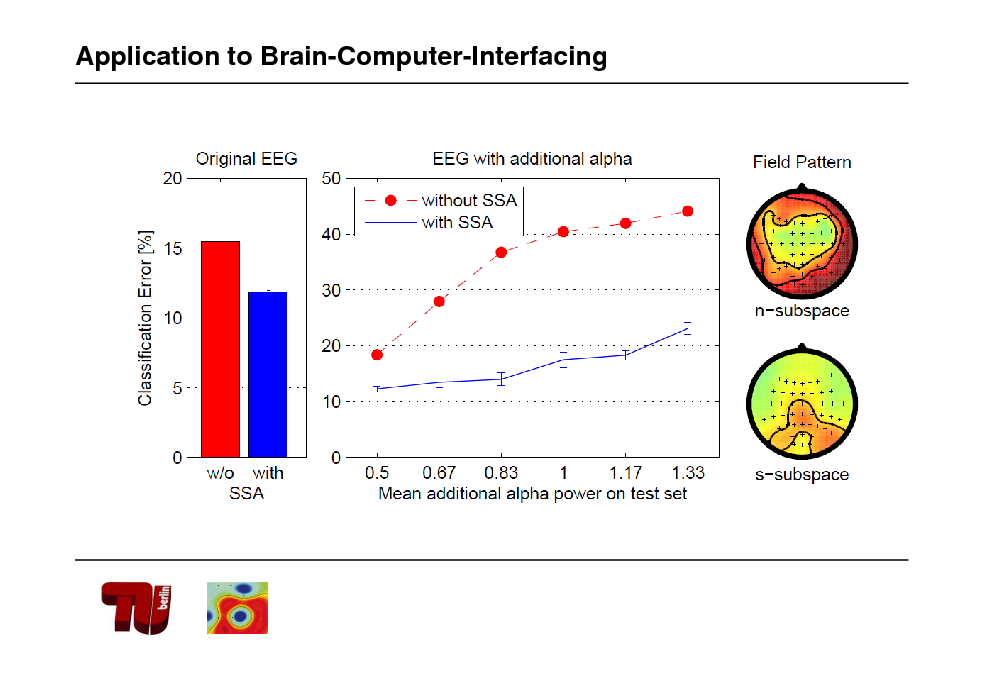
Application to Brain-Computer-Interfacing
69
Real Man Machine Interaction
70
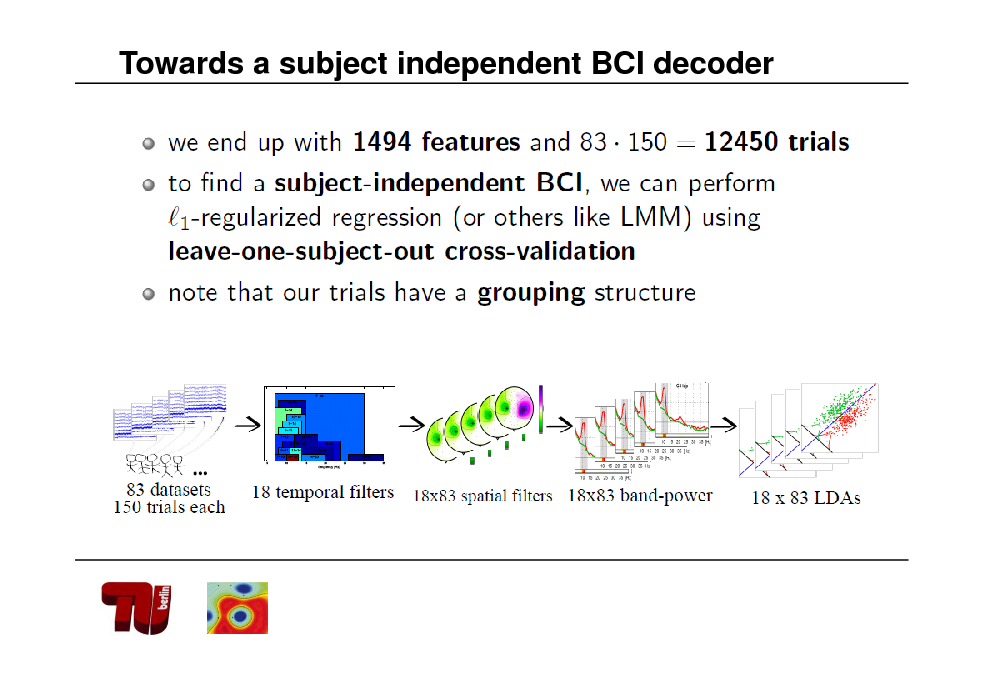
Towards a subject independent BCI decoder
71
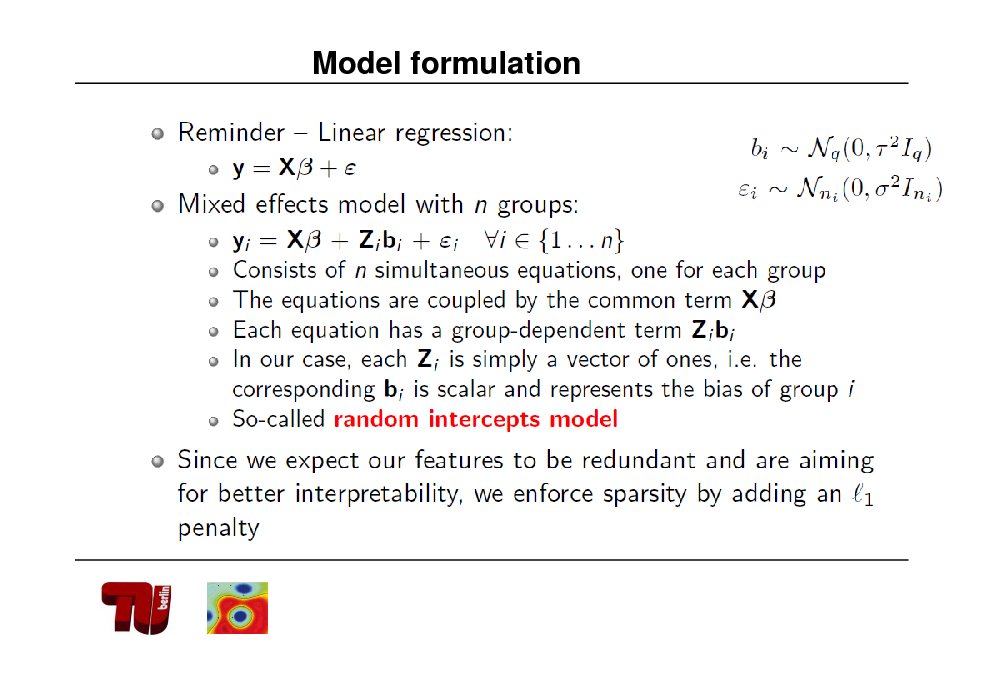
Model formulation
72
![Slide: Linear Mixed Effects Model: intuition
[Fazli, Mller et al. 2011]](https://yosinski.com/mlss12/media/slides/MLSS-2012-Muller-Brain-Computer-Interfacing_073.png)
Linear Mixed Effects Model: intuition
[Fazli, Mller et al. 2011]
73
![Slide: Approach to Cure BCI Illiteracy
Runs 4 6
supervised CSP + sel.Lap. unsupervised CSP
Runs 1 3
fixed Laplace
Direct feedback -> Unspecific LDA classifier. Each trial, perform adaptation of the cls. Features: log band power (alpha and beta). Laplacian channels C3, C4 and Cz.
Compute CSP and sel. Laps. from runs 1-3. Fixed CSP filters, automated laps. selection. Each trial retrain the classifier.
Runs 7 8
Compute CSP from runs 4-6. Perform unsupervised adaptation of pooled mean. Update the bias of the classifier.
[cf. Vidaurre, Blankertz, Mller et al. Neural Comp. to appear]](https://yosinski.com/mlss12/media/slides/MLSS-2012-Muller-Brain-Computer-Interfacing_074.png)
Approach to Cure BCI Illiteracy
Runs 4 6
supervised CSP + sel.Lap. unsupervised CSP
Runs 1 3
fixed Laplace
Direct feedback -> Unspecific LDA classifier. Each trial, perform adaptation of the cls. Features: log band power (alpha and beta). Laplacian channels C3, C4 and Cz.
Compute CSP and sel. Laps. from runs 1-3. Fixed CSP filters, automated laps. selection. Each trial retrain the classifier.
Runs 7 8
Compute CSP from runs 4-6. Perform unsupervised adaptation of pooled mean. Update the bias of the classifier.
[cf. Vidaurre, Blankertz, Mller et al. Neural Comp. to appear]
74
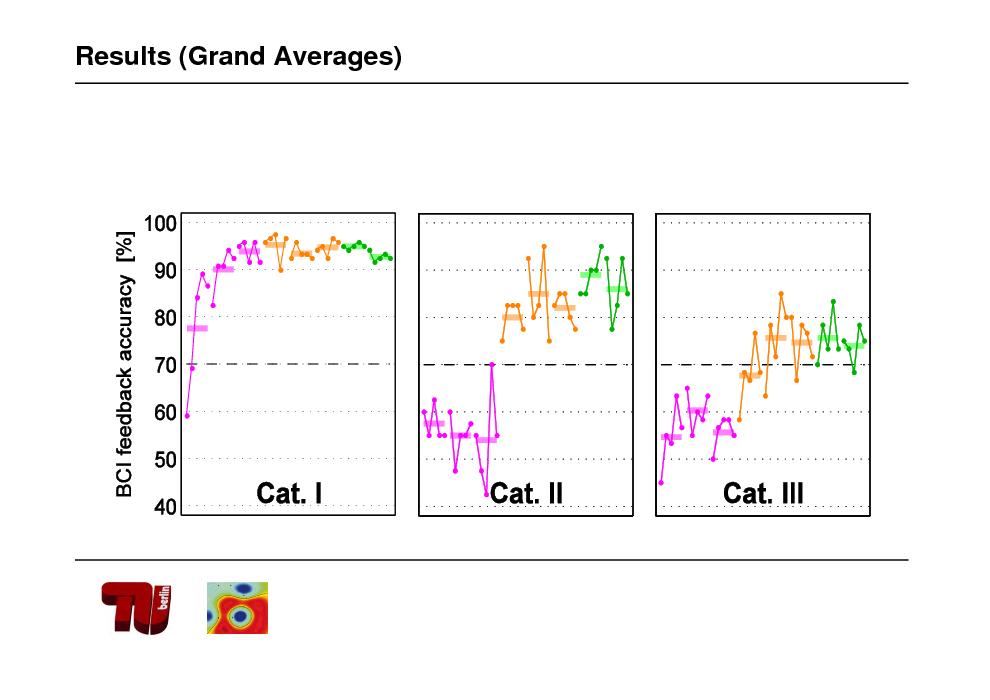
Results (Grand Averages)
75
![Slide: Example: one subject of Cat. III
Runs 1 and 2
!
Runs 7 and 8
[cf. Vidaurre, Blankertz, Mller et al. 2009]](https://yosinski.com/mlss12/media/slides/MLSS-2012-Muller-Brain-Computer-Interfacing_076.png)
Example: one subject of Cat. III
Runs 1 and 2
!
Runs 7 and 8
[cf. Vidaurre, Blankertz, Mller et al. 2009]
76
Multimodal
77
![Slide: Different physiological Features
EEG signals
Slow Features, e.g. Event Related Potential/Slow Cortical Potentials (ERP/SCP)
Independent??? Neurophysiology: YES
Maps
Oscillatory Features, e.g. Event Related Desynchronization/ Synchronization (ERD/ERS)
[Dornhege, et al. 2006]](https://yosinski.com/mlss12/media/slides/MLSS-2012-Muller-Brain-Computer-Interfacing_078.png)
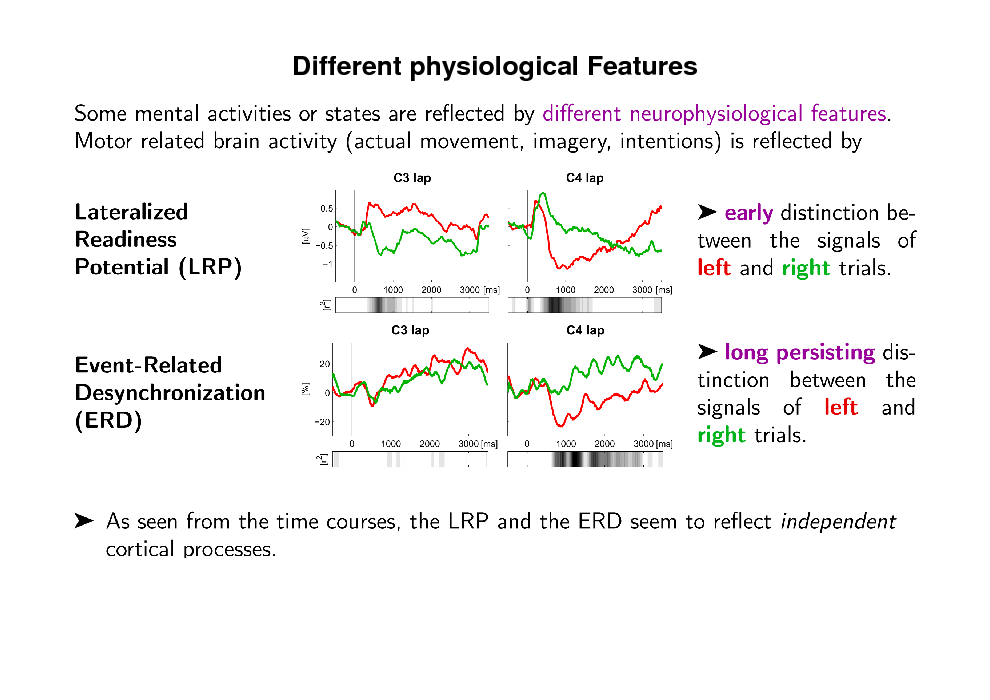
Different physiological Features
EEG signals
Slow Features, e.g. Event Related Potential/Slow Cortical Potentials (ERP/SCP)
Independent??? Neurophysiology: YES
Maps
Oscillatory Features, e.g. Event Related Desynchronization/ Synchronization (ERD/ERS)
[Dornhege, et al. 2006]
78
Different physiological Features
79
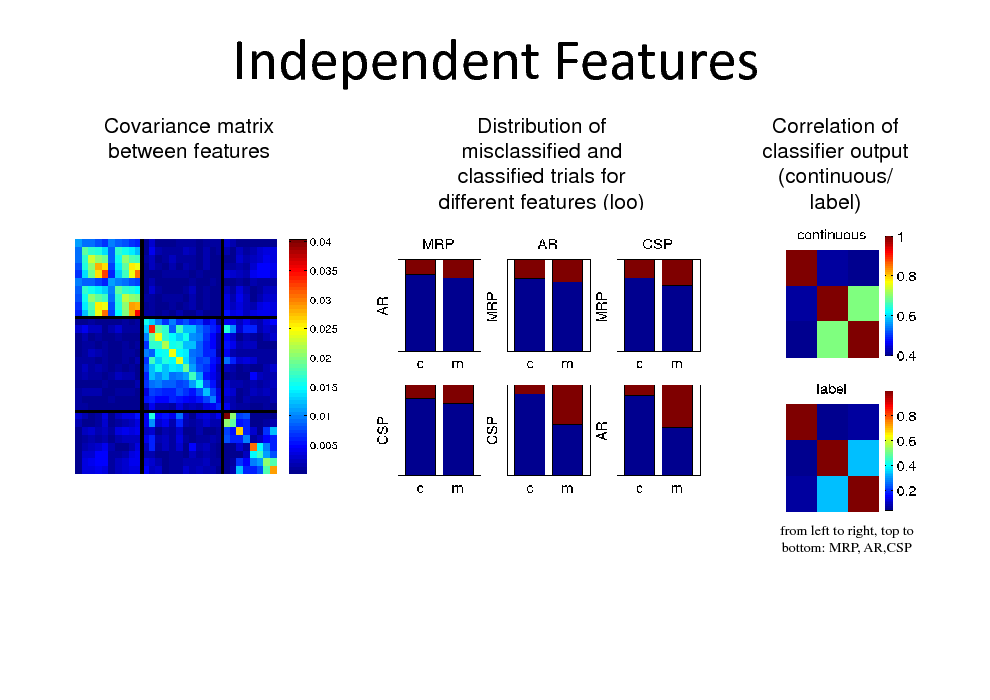
Independent Features
Covariance matrix between features Distribution of misclassified and classified trials for different features (loo) Correlation of classifier output (continuous/ label)
from left to right, top to bottom: MRP, AR,CSP
80
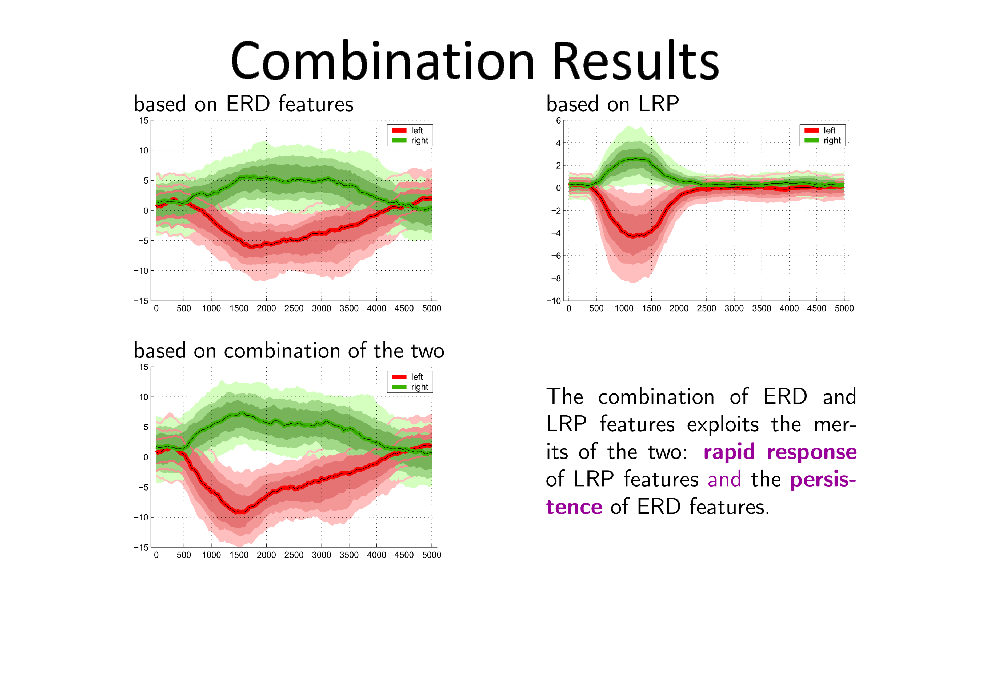
Combination Results
81
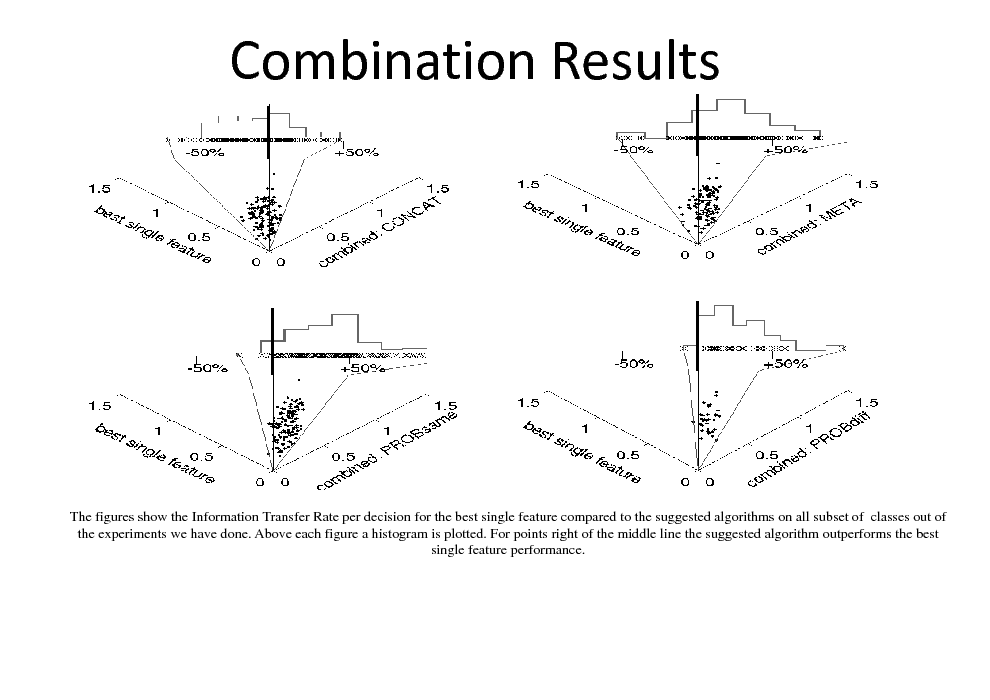
Combination Results
The figures show the Information Transfer Rate per decision for the best single feature compared to the suggested algorithms on all subset of classes out of the experiments we have done. Above each figure a histogram is plotted. For points right of the middle line the suggested algorithm outperforms the best single feature performance.
82
![Slide: Example: NIRS-EEG Brain Computer Interfaces
[Fazli et al. Neuroimage 2012]
94](https://yosinski.com/mlss12/media/slides/MLSS-2012-Muller-Brain-Computer-Interfacing_083.png)
Example: NIRS-EEG Brain Computer Interfaces
[Fazli et al. Neuroimage 2012]
94
83
Photon Transport in the Human Brain Tissue
Near-Infrared light can penetrate the brain banana-shaped measurement volume for non-invasive NIRS
95
84
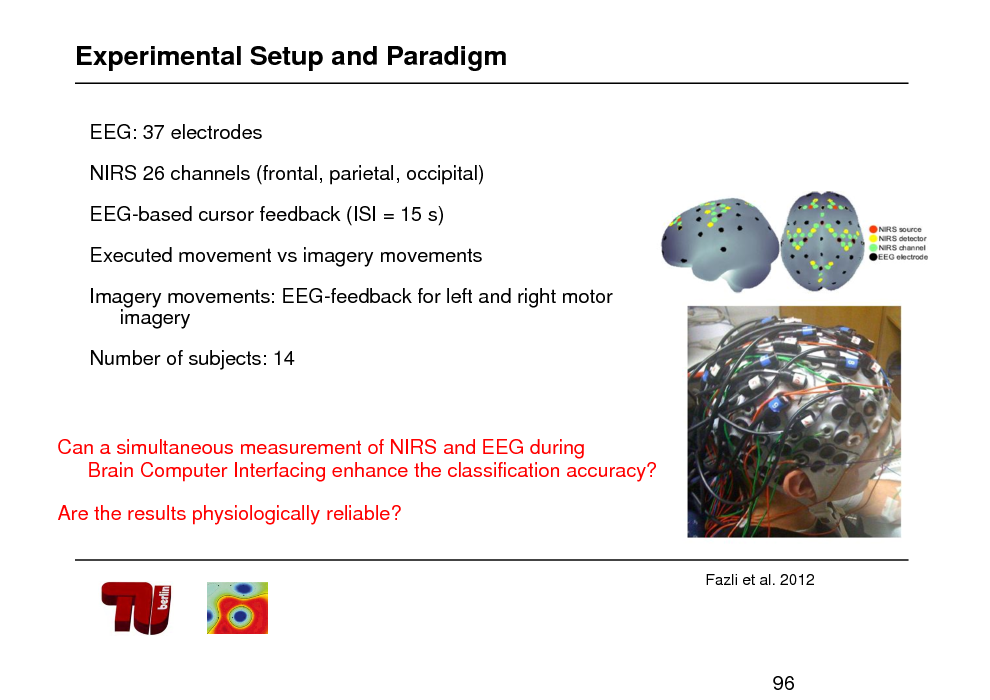
Experimental Setup and Paradigm
EEG: 37 electrodes NIRS 26 channels (frontal, parietal, occipital) EEG-based cursor feedback (ISI = 15 s) Executed movement vs imagery movements Imagery movements: EEG-feedback for left and right motor imagery
Number of subjects: 14
Can a simultaneous measurement of NIRS and EEG during Brain Computer Interfacing enhance the classification accuracy? Are the results physiologically reliable?
Fazli et al. 2012
96
85
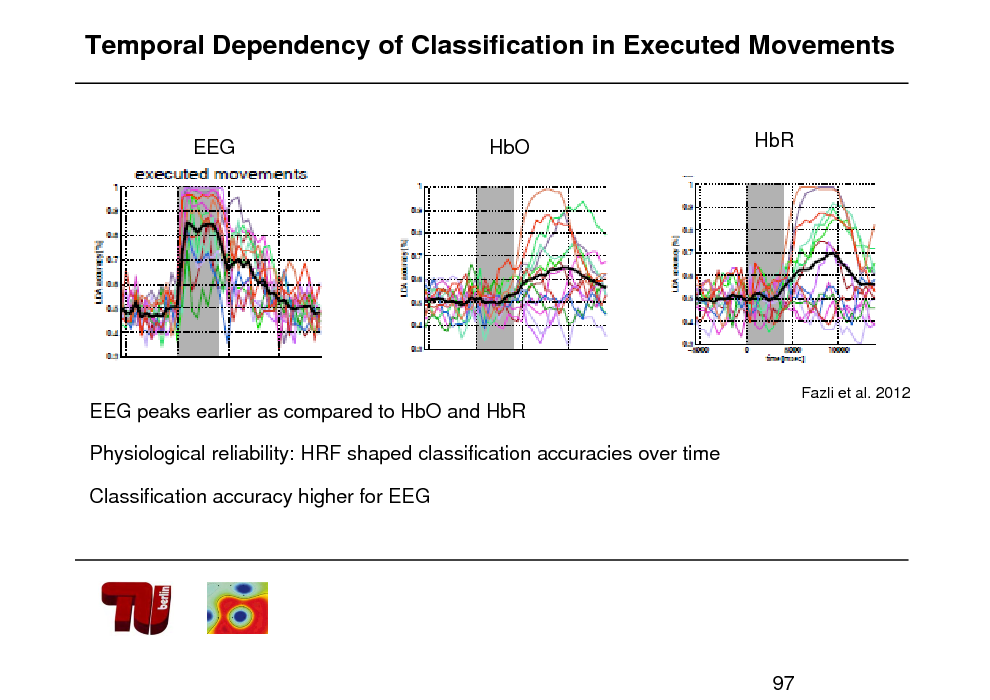
Temporal Dependency of Classification in Executed Movements
EEG
HbO
HbR
Fazli et al. 2012
EEG peaks earlier as compared to HbO and HbR Physiological reliability: HRF shaped classification accuracies over time Classification accuracy higher for EEG
97
86
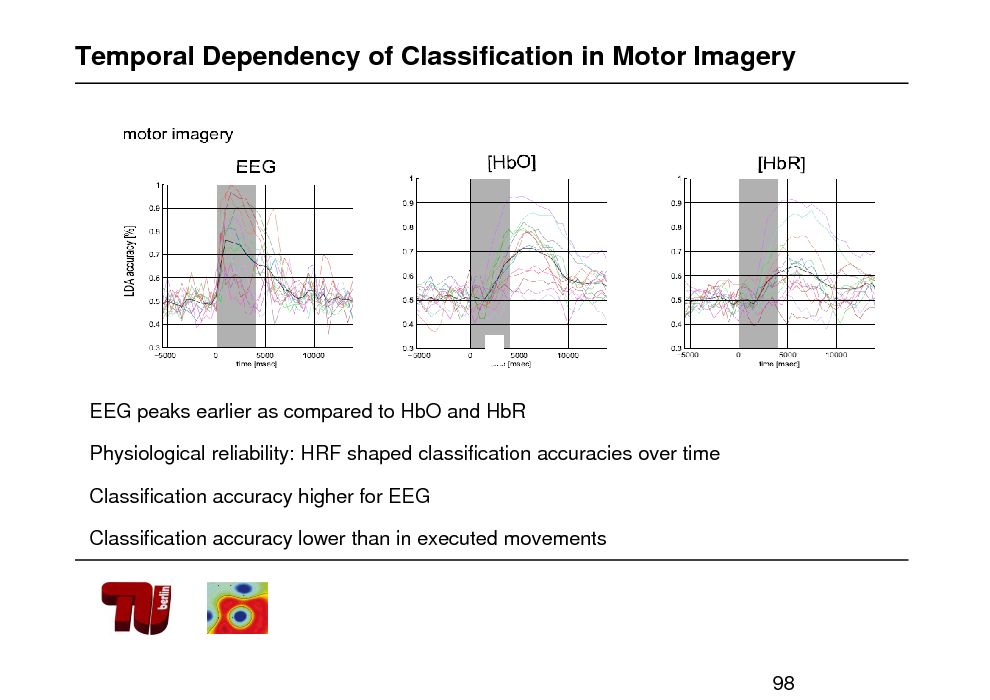
Temporal Dependency of Classification in Motor Imagery
EEG peaks earlier as compared to HbO and HbR Physiological reliability: HRF shaped classification accuracies over time Classification accuracy higher for EEG Classification accuracy lower than in executed movements
98
87
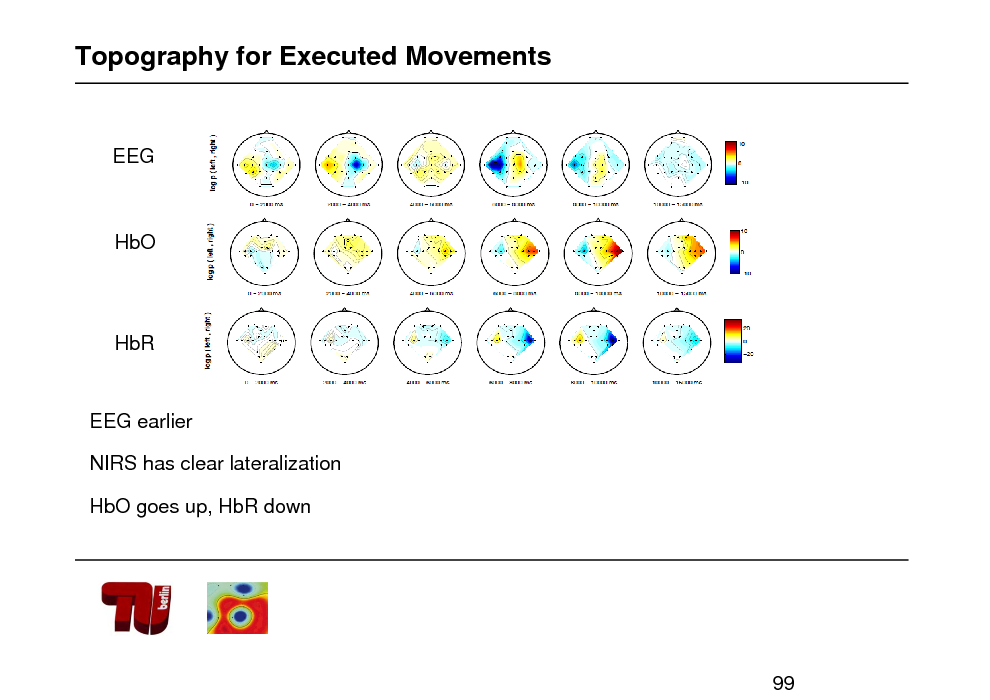
Topography for Executed Movements
EEG
HbO
HbR
EEG earlier NIRS has clear lateralization HbO goes up, HbR down
99
88
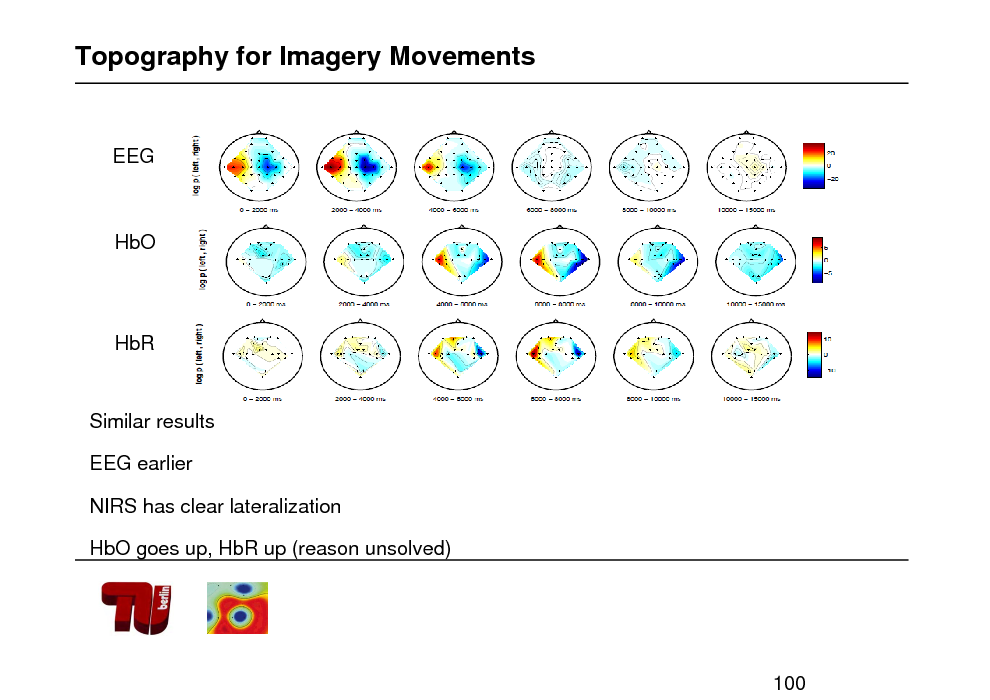
Topography for Imagery Movements
EEG
HbO
HbR
Similar results EEG earlier NIRS has clear lateralization HbO goes up, HbR up (reason unsolved)
100
89
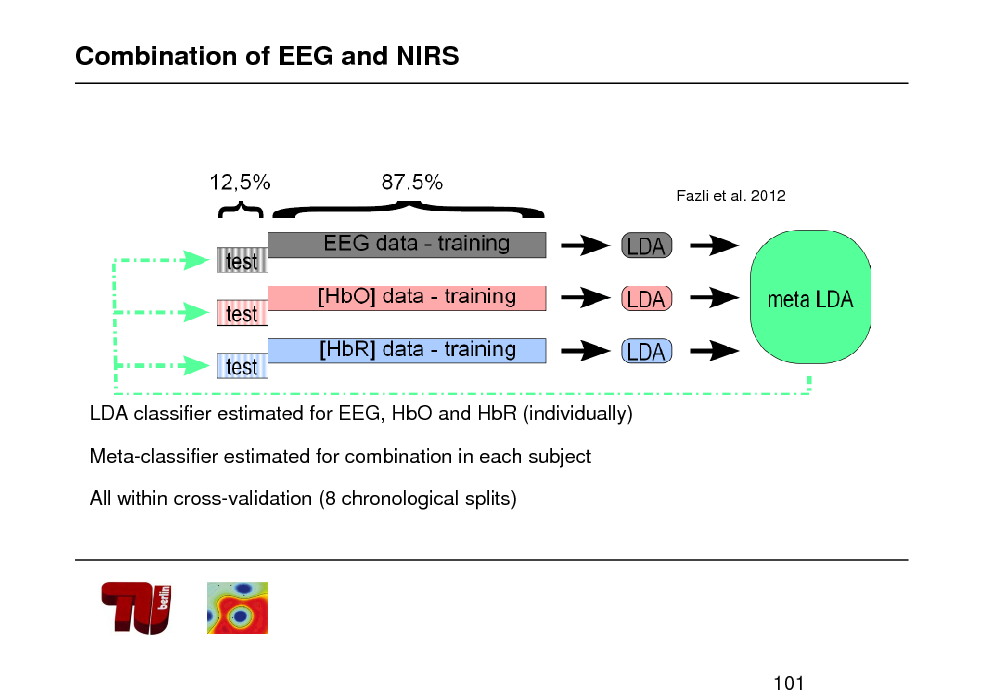
Combination of EEG and NIRS
Fazli et al. 2012
LDA classifier estimated for EEG, HbO and HbR (individually) Meta-classifier estimated for combination in each subject All within cross-validation (8 chronological splits)
101
90
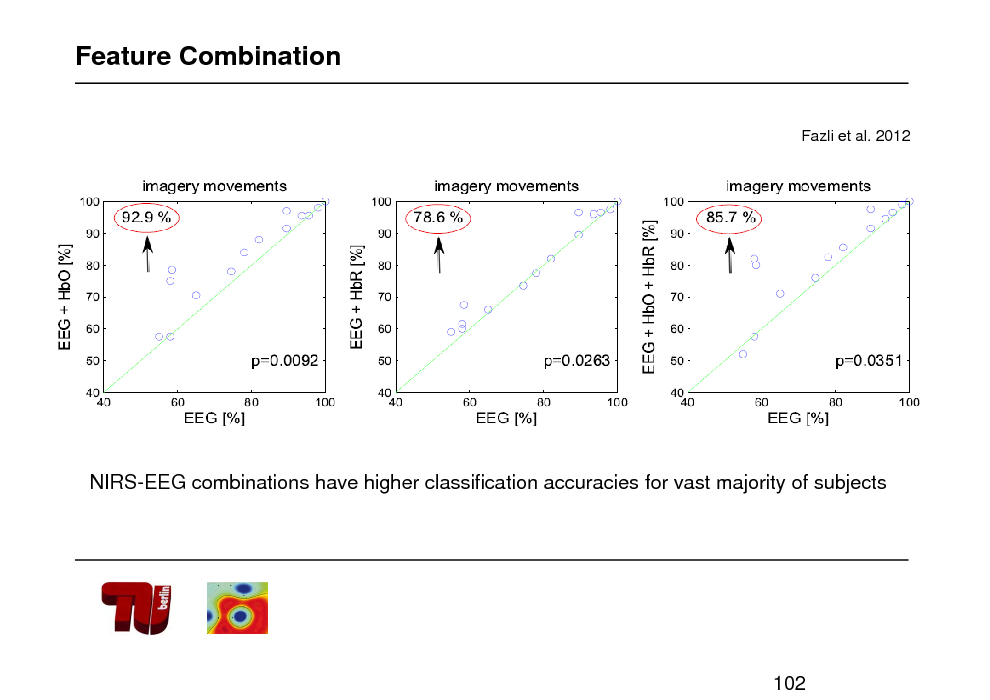
Feature Combination
Fazli et al. 2012
NIRS-EEG combinations have higher classification accuracies for vast majority of subjects
102
91
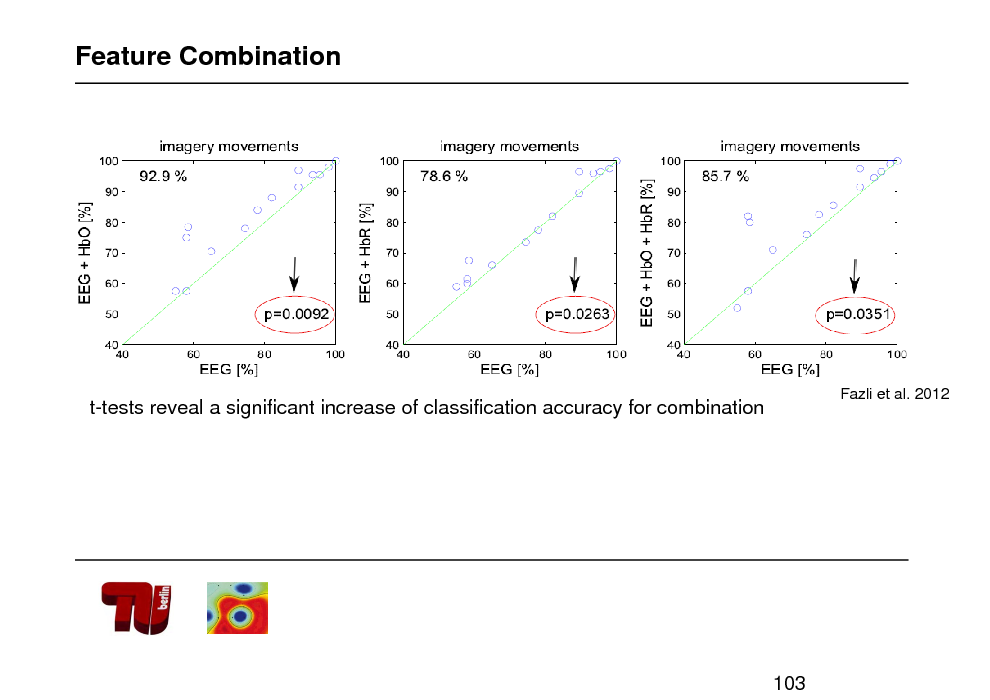
Feature Combination
t-tests reveal a significant increase of classification accuracy for combination
Fazli et al. 2012
103
92
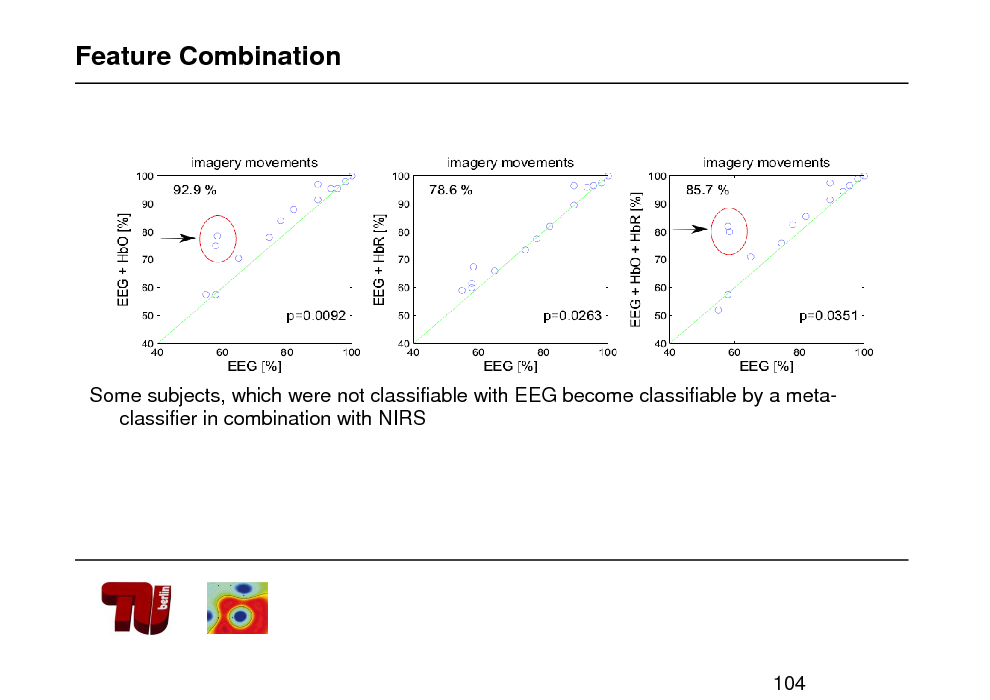
Feature Combination
Some subjects, which were not classifiable with EEG become classifiable by a metaclassifier in combination with NIRS
104
93
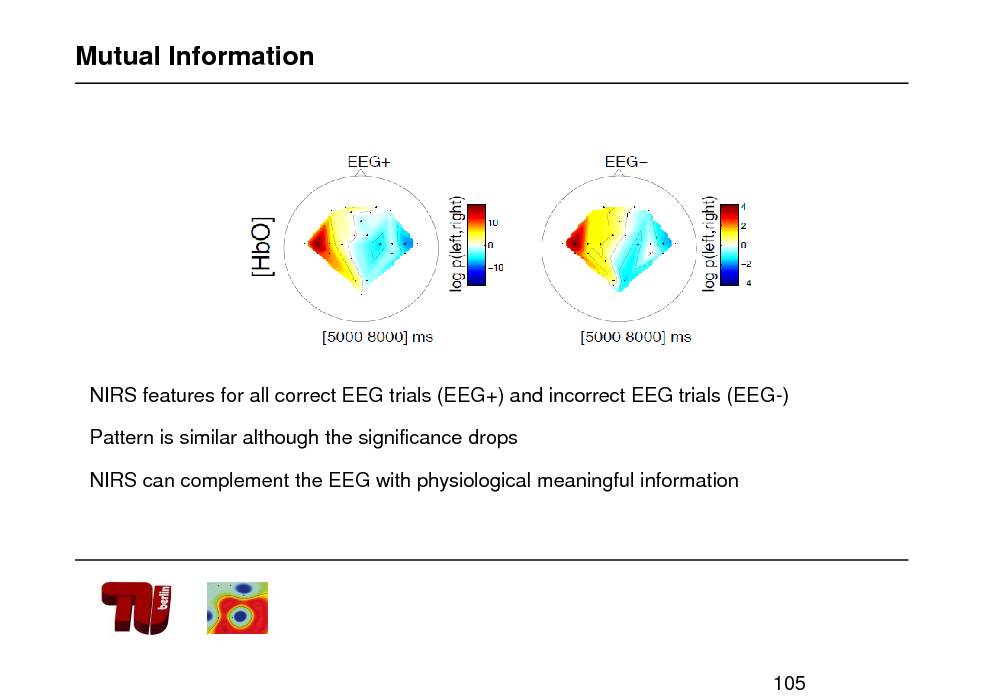
Mutual Information
NIRS features for all correct EEG trials (EEG+) and incorrect EEG trials (EEG-) Pattern is similar although the significance drops NIRS can complement the EEG with physiological meaningful information
105
94
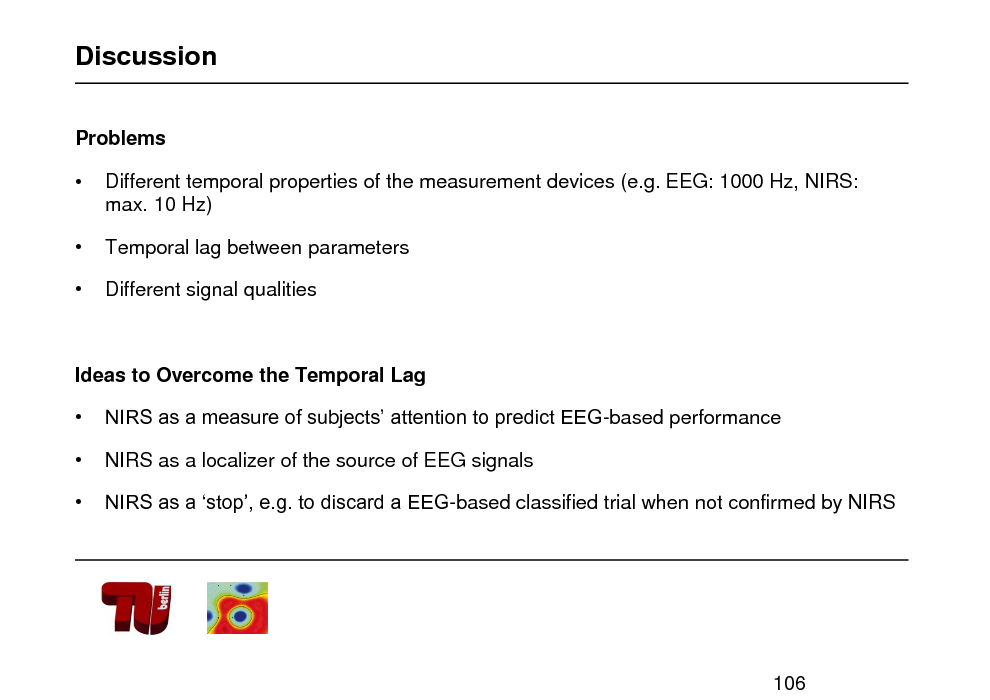
Discussion
Problems
Different temporal properties of the measurement devices (e.g. EEG: 1000 Hz, NIRS: max. 10 Hz)
Temporal lag between parameters Different signal qualities
Ideas to Overcome the Temporal Lag NIRS as a measure of subjects attention to predict EEG-based performance NIRS as a localizer of the source of EEG signals NIRS as a stop, e.g. to discard a EEG-based classified trial when not confirmed by NIRS
106
95
![Slide: Correlating apples and oranges
[Biessmann et al. Neuroimage 2012, Machine Learning 2010]
107](https://yosinski.com/mlss12/media/slides/MLSS-2012-Muller-Brain-Computer-Interfacing_096.png)
Correlating apples and oranges
[Biessmann et al. Neuroimage 2012, Machine Learning 2010]
107
96
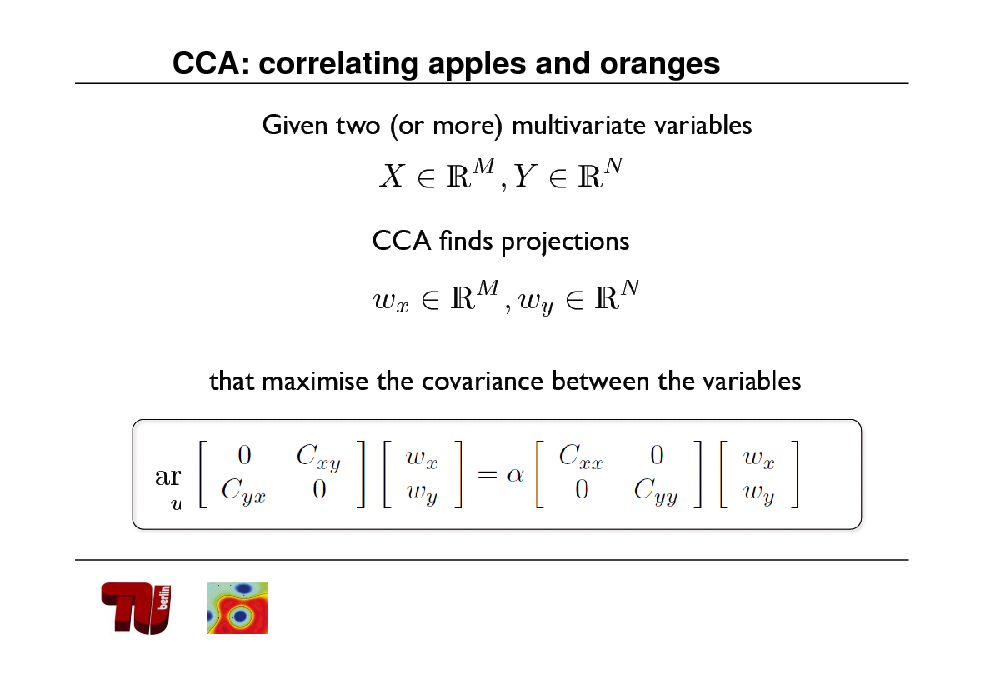
CCA: correlating apples and oranges
97
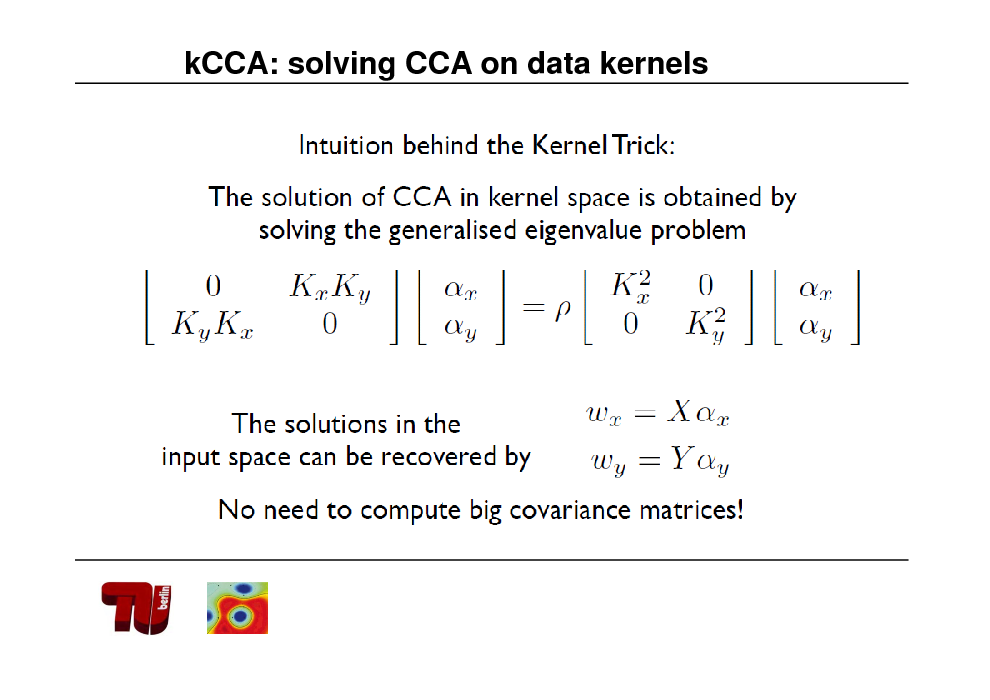
kCCA: solving CCA on data kernels
98
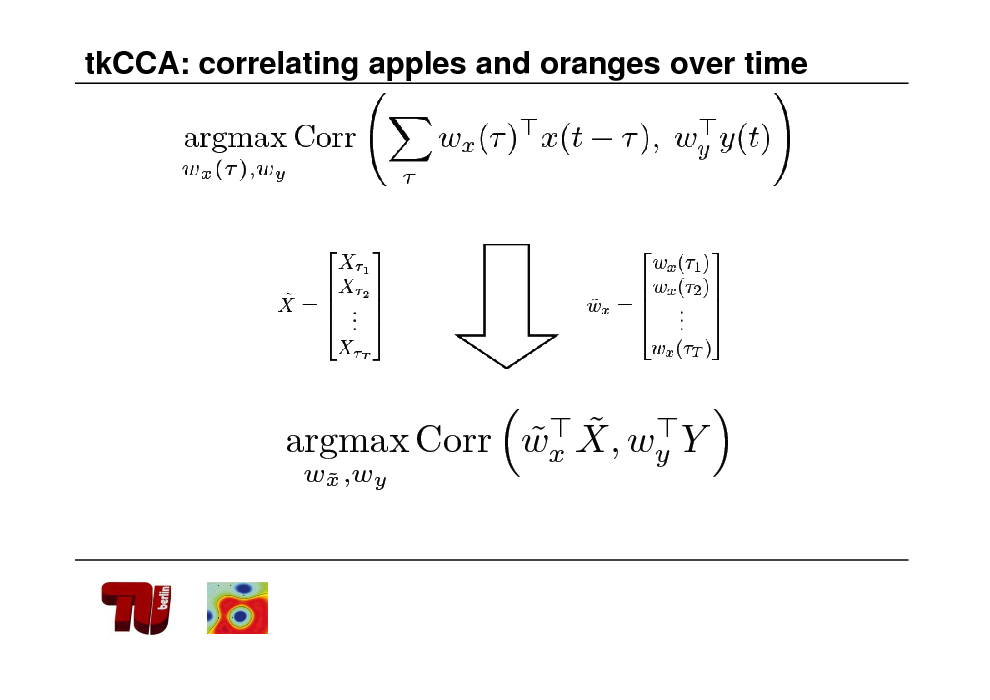
tkCCA: correlating apples and oranges over time
99
CCA: correlating apples and oranges
100
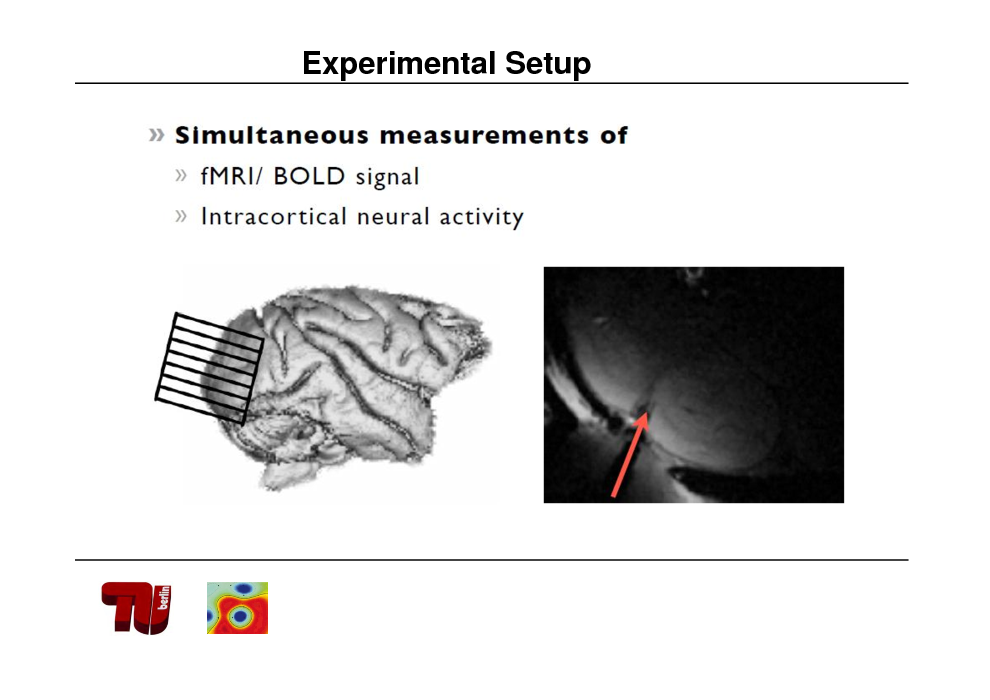
Experimental Setup
101
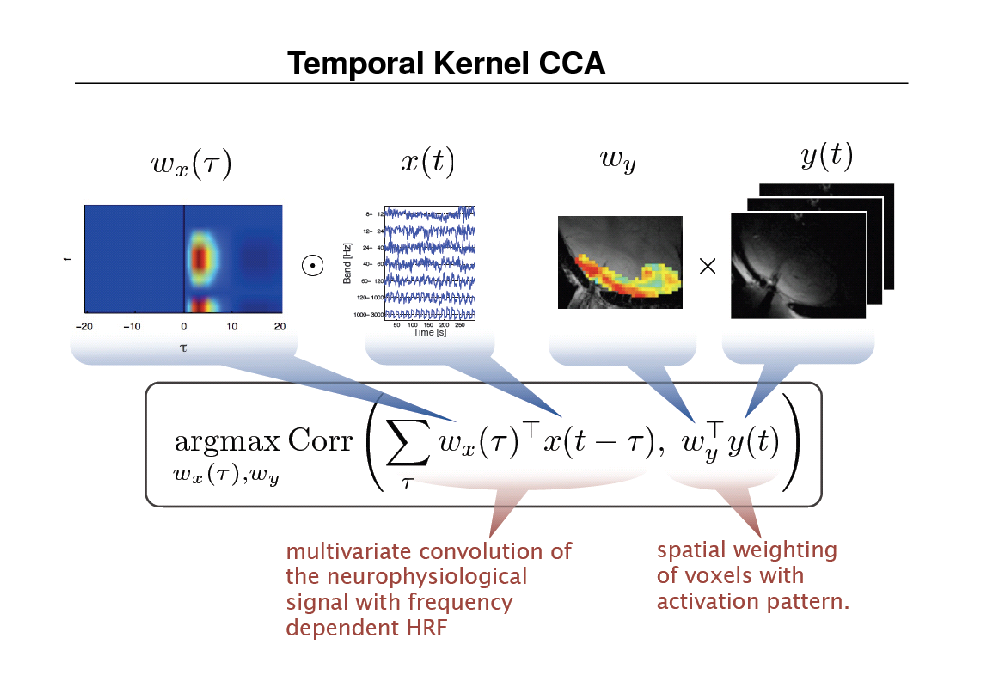
Temporal Kernel CCA
102
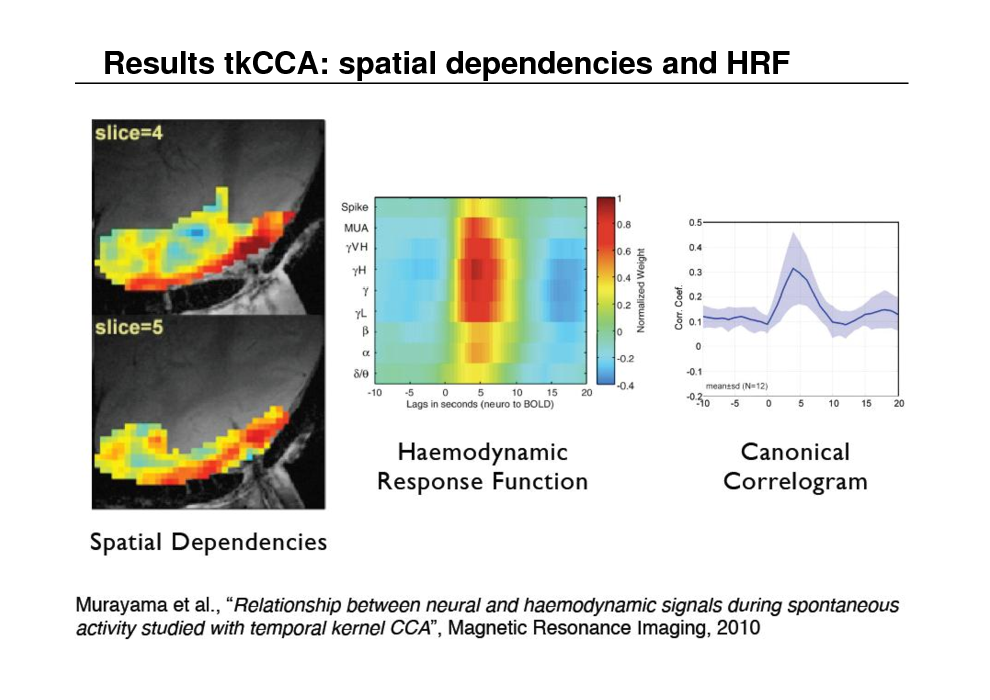
Results tkCCA: spatial dependencies and HRF
103
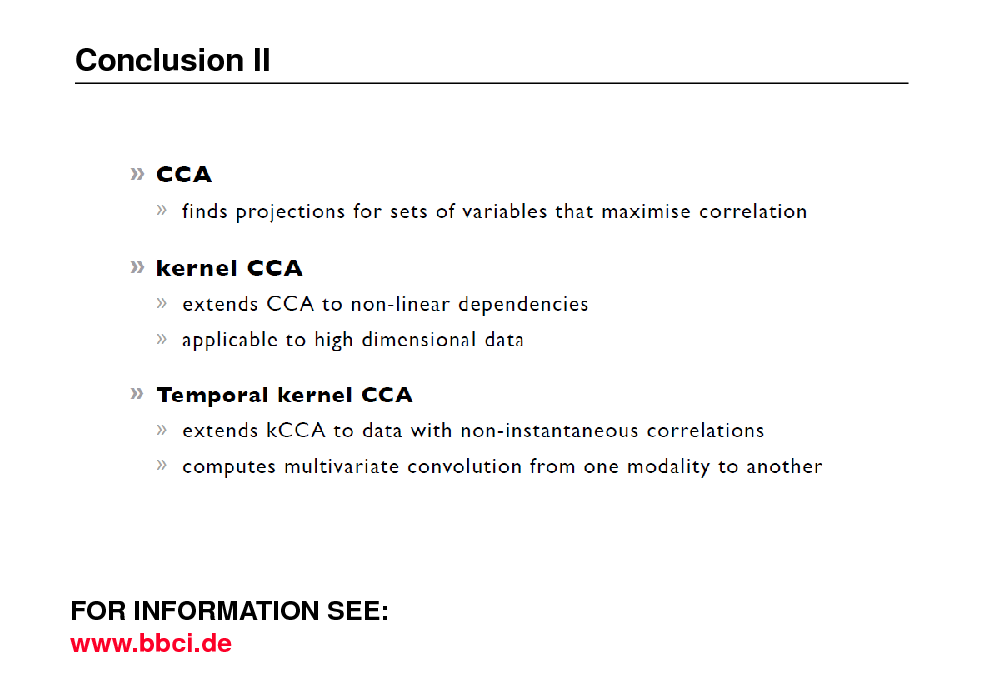
Conclusion II
FOR INFORMATION SEE: www.bbci.de
104
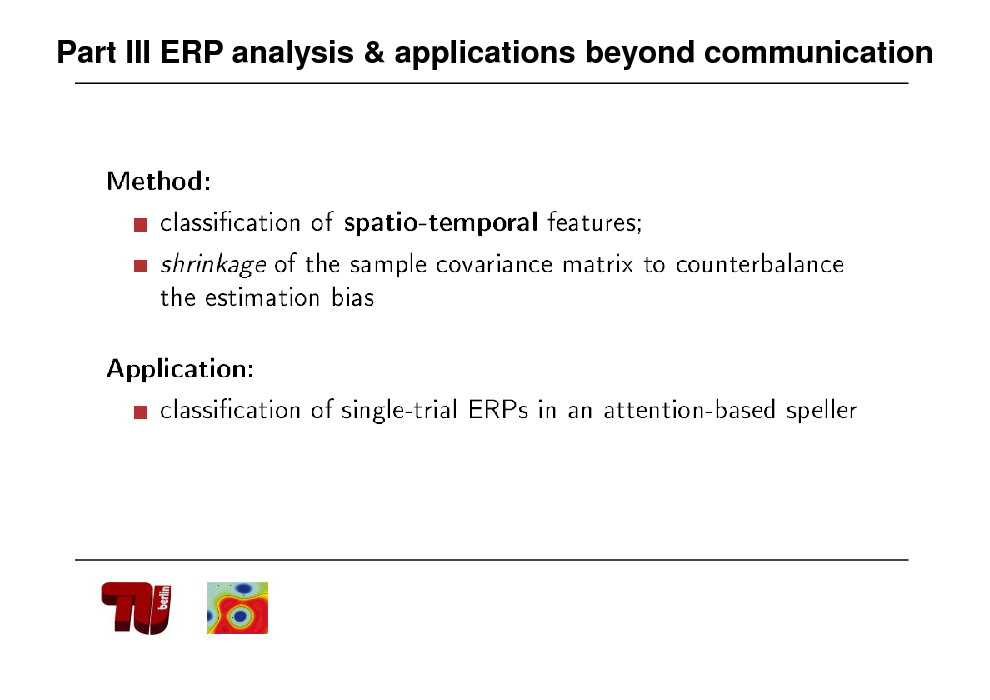
Part III ERP analysis & applications beyond communication
105
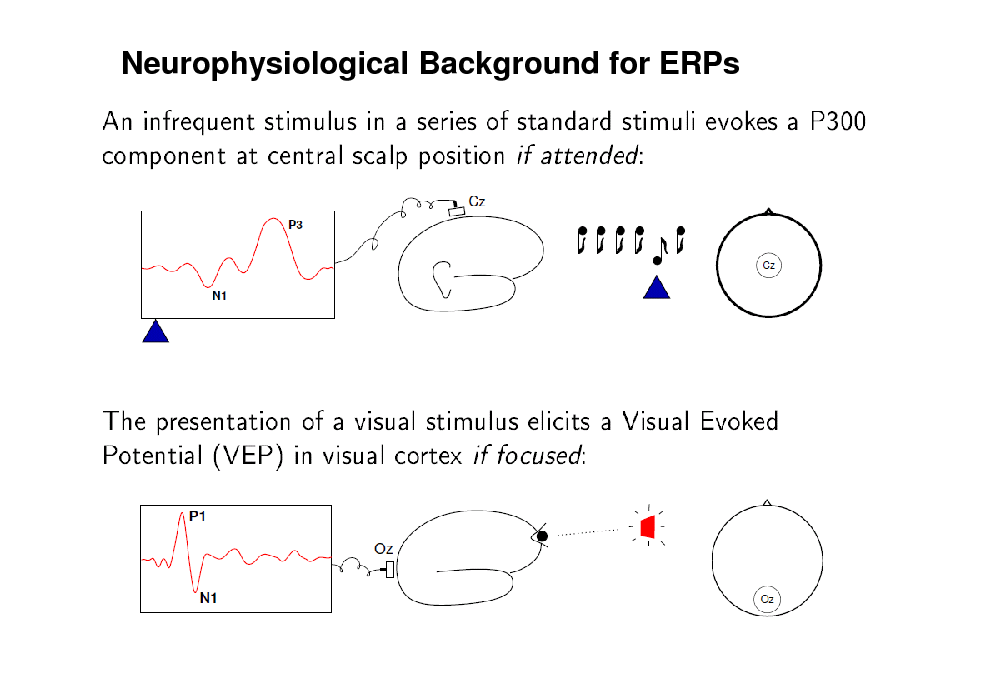
Neurophysiological Background for ERPs
106
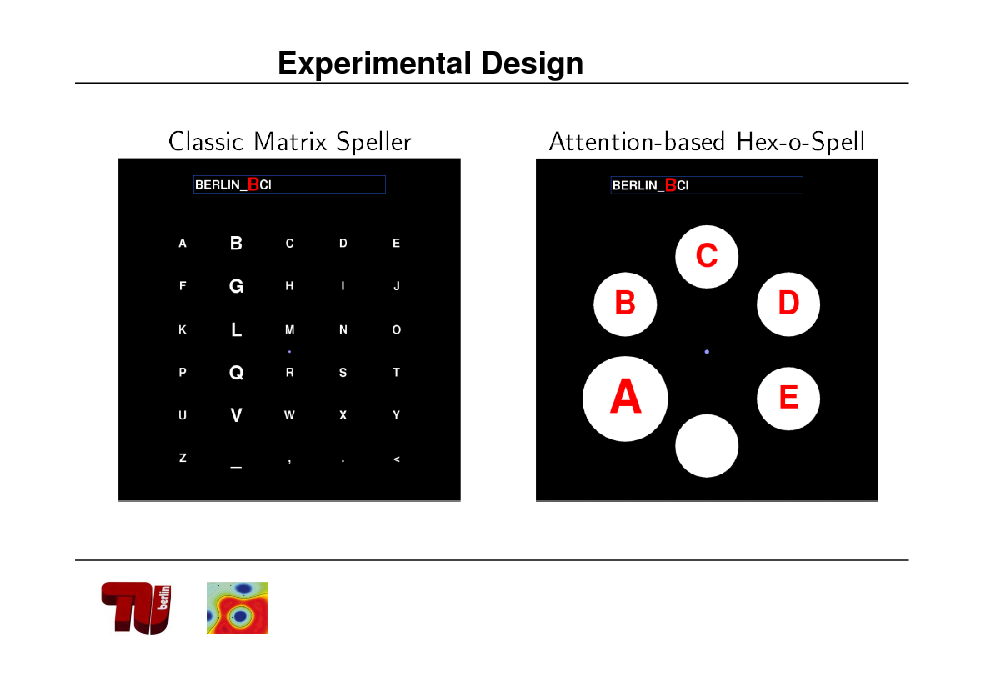
Experimental Design
107
P300 in action: Hex-o-spell
108
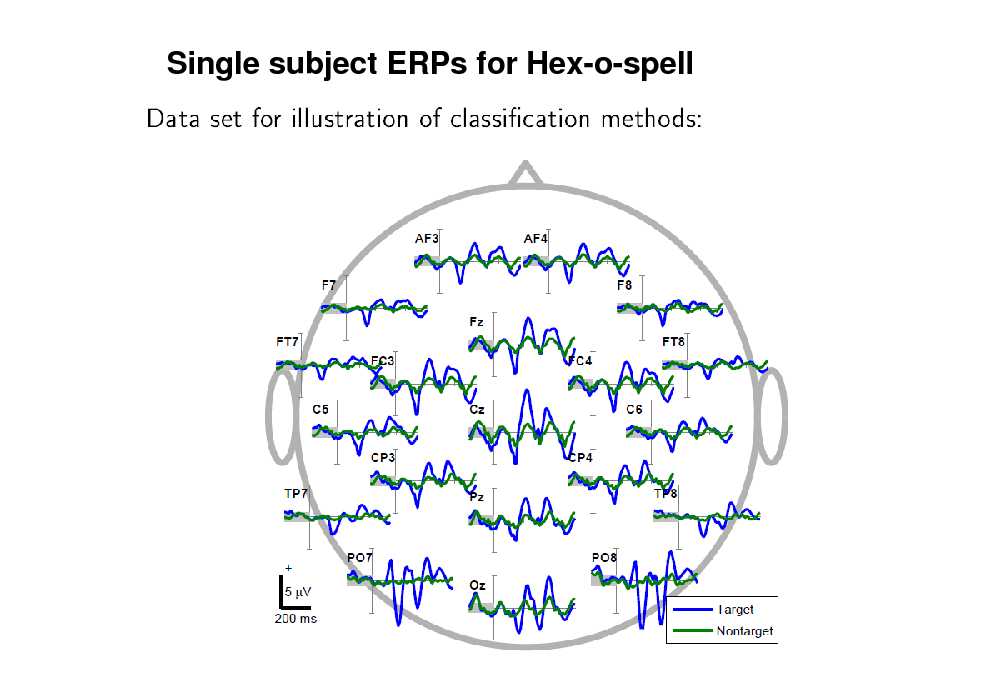
Single subject ERPs for Hex-o-spell
109
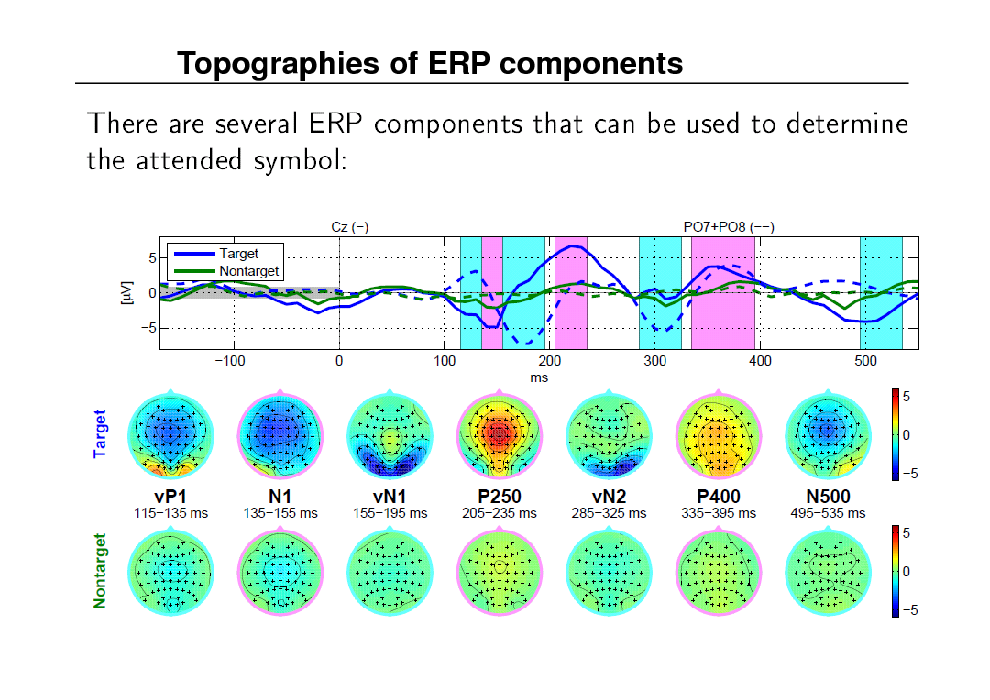
Topographies of ERP components
110
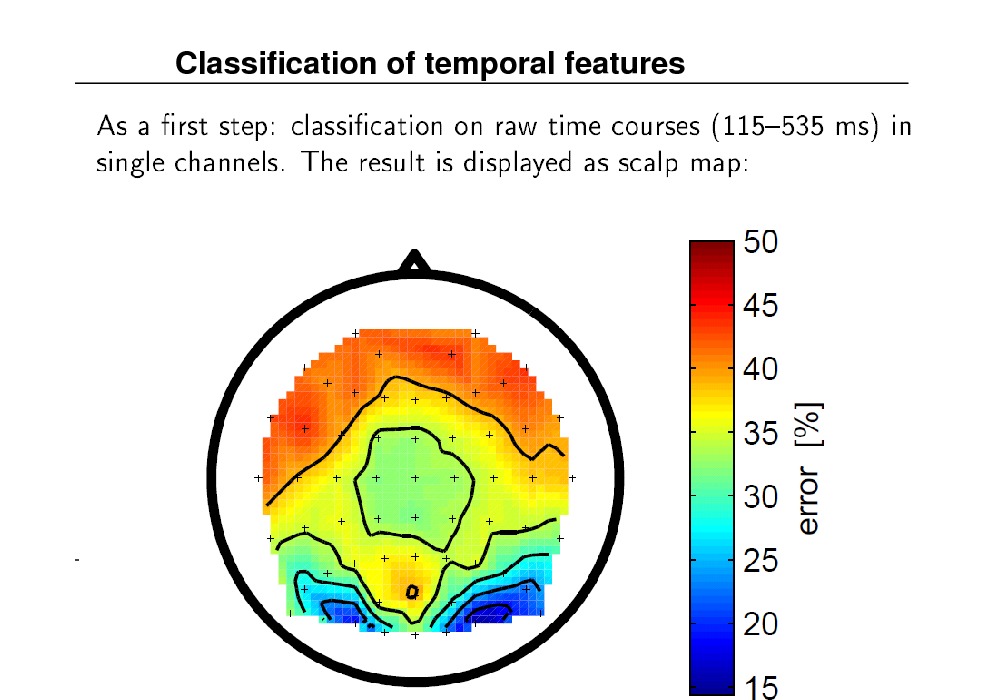
Classification of temporal features
111
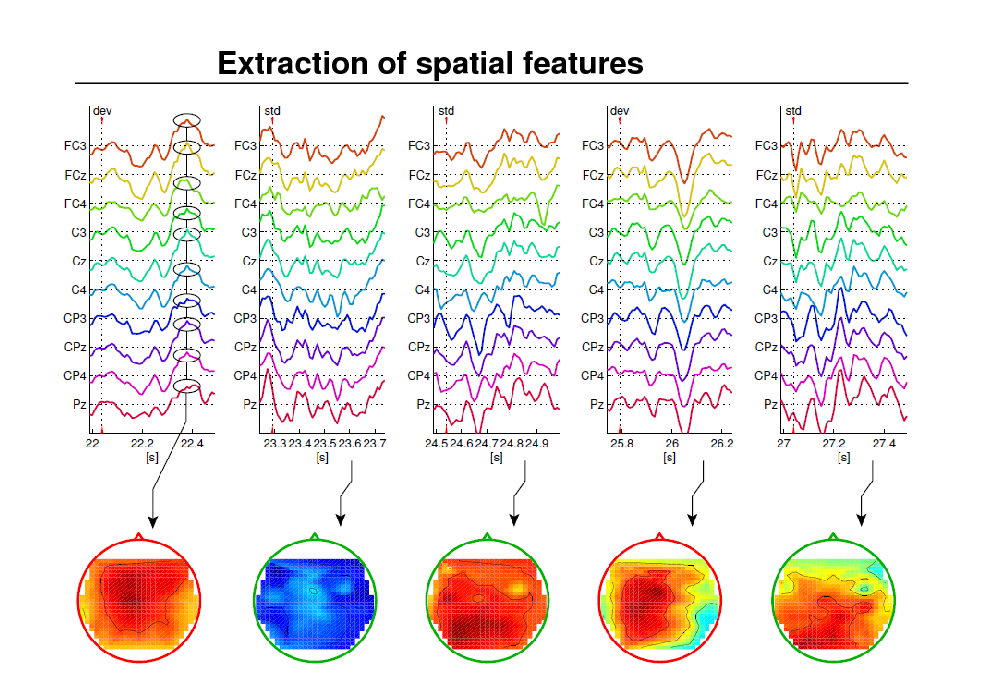
Extraction of spatial features
112
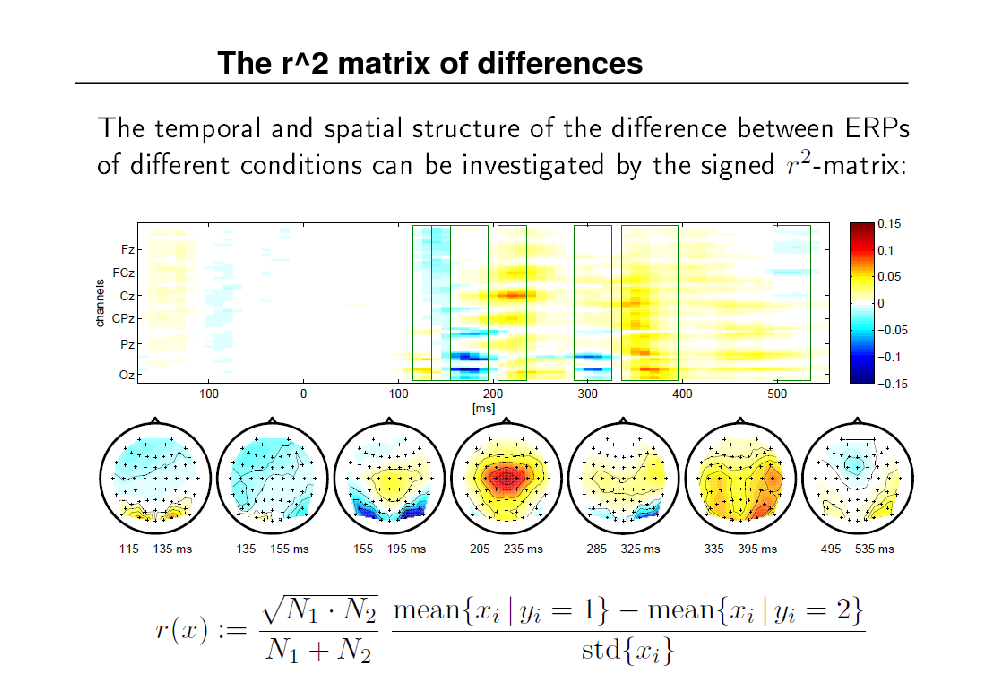
The r^2 matrix of differences
113
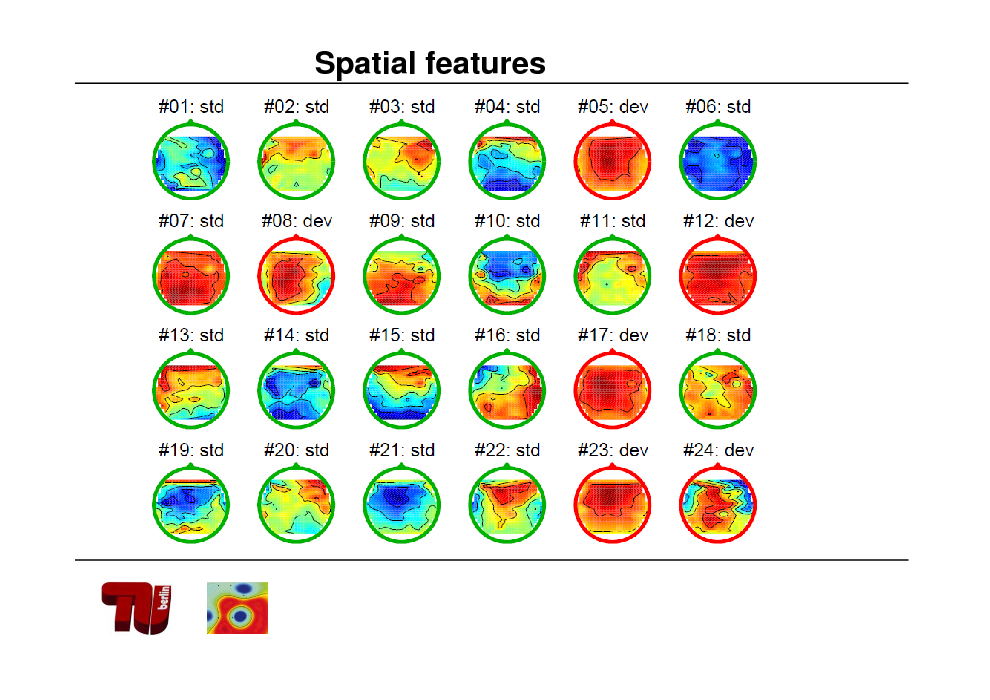
Spatial features
114
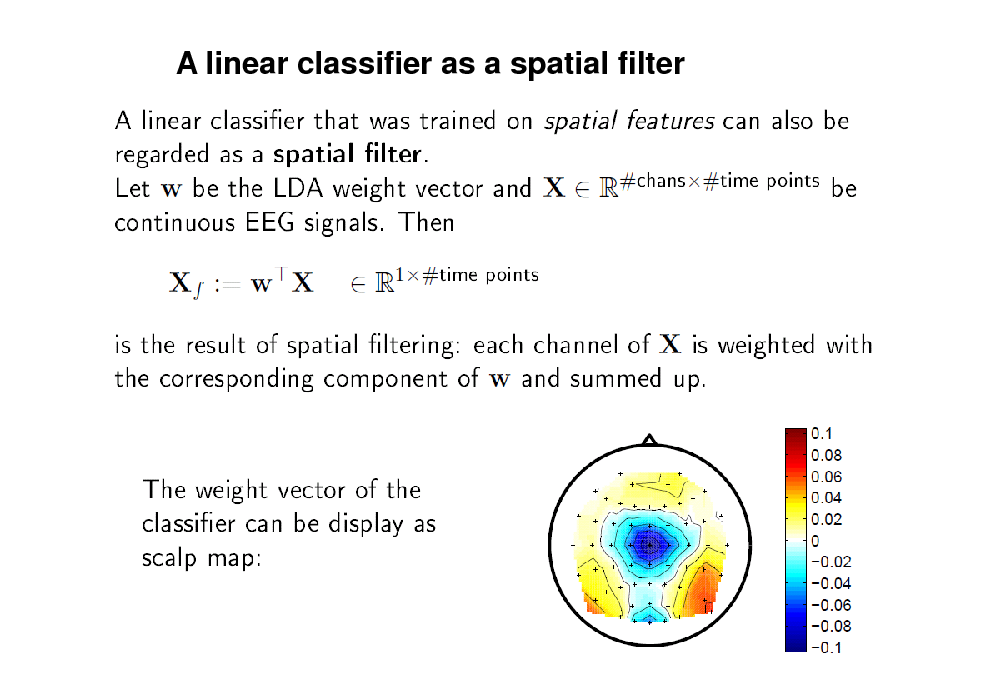
A linear classifier as a spatial filter
115
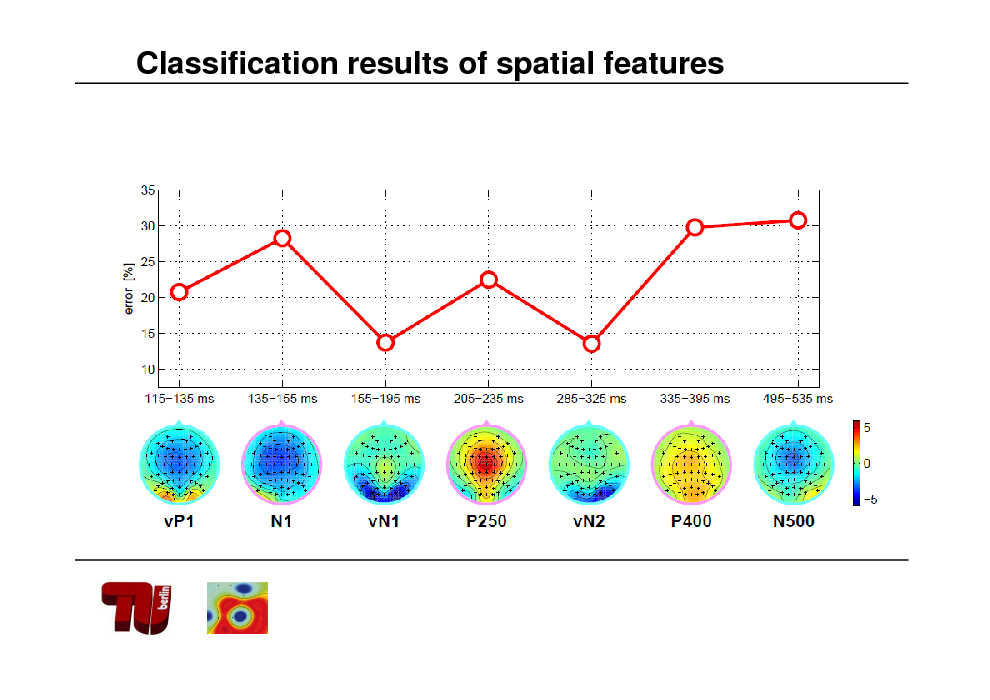
Classification results of spatial features
116
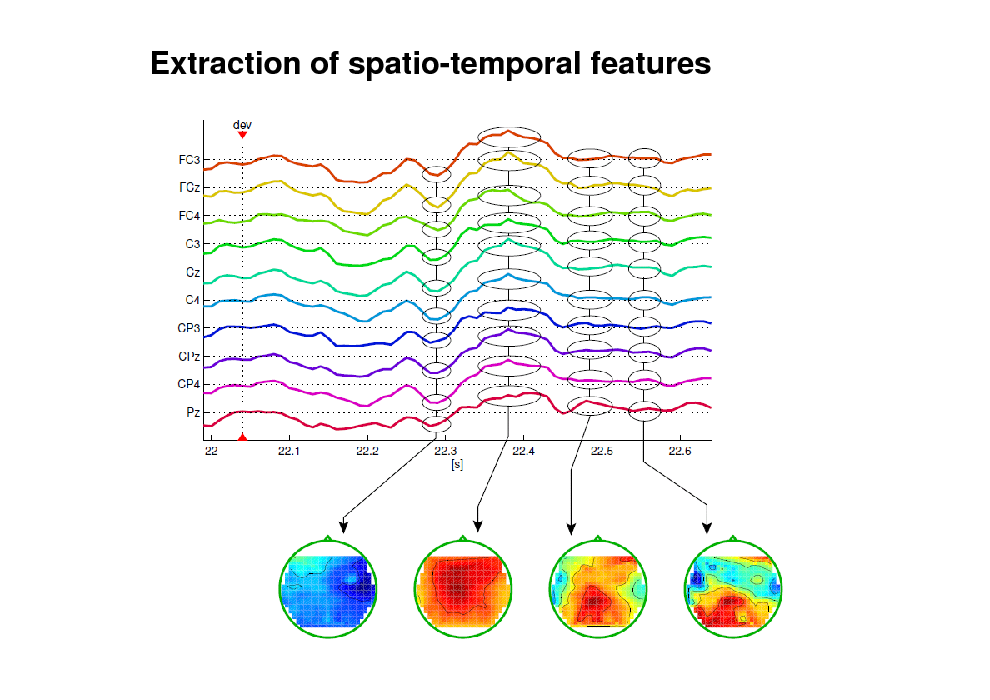
Extraction of spatio-temporal features
117
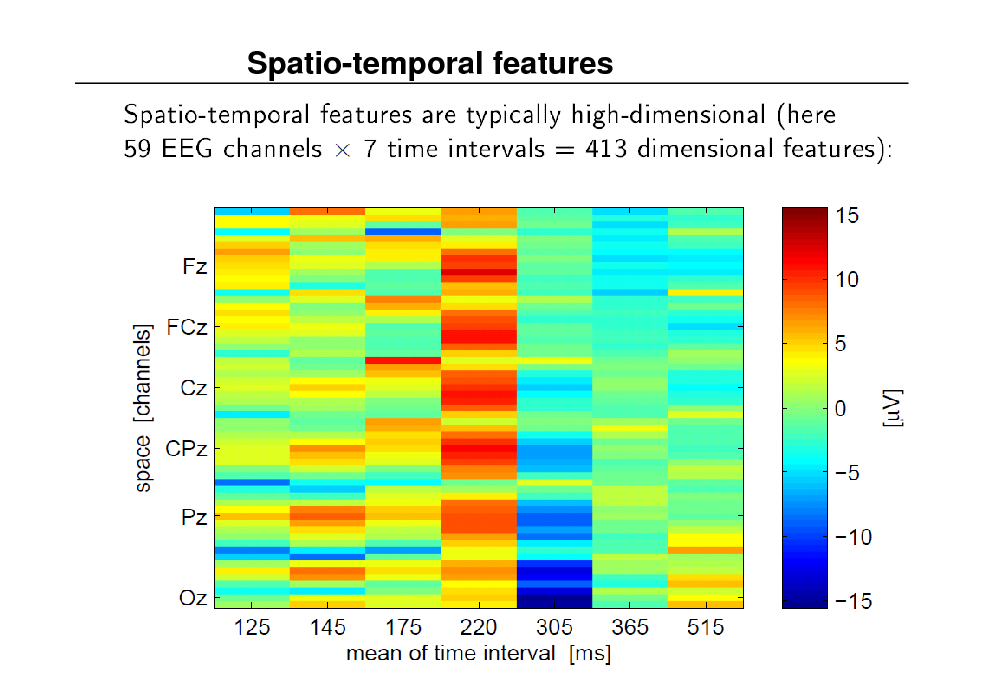
Spatio-temporal features
118
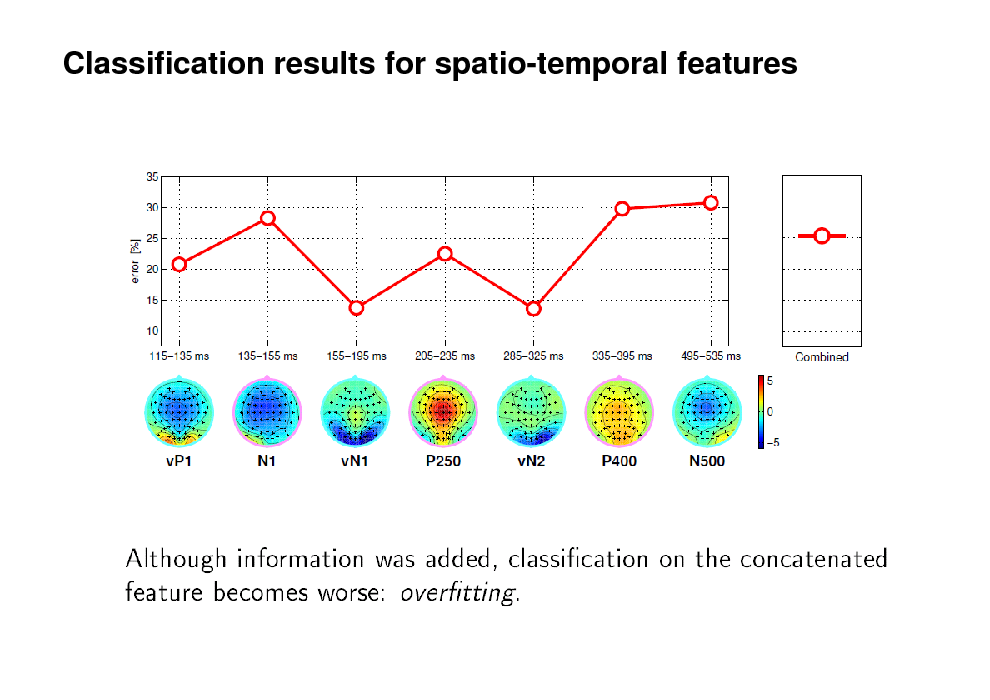
Classification results for spatio-temporal features
119
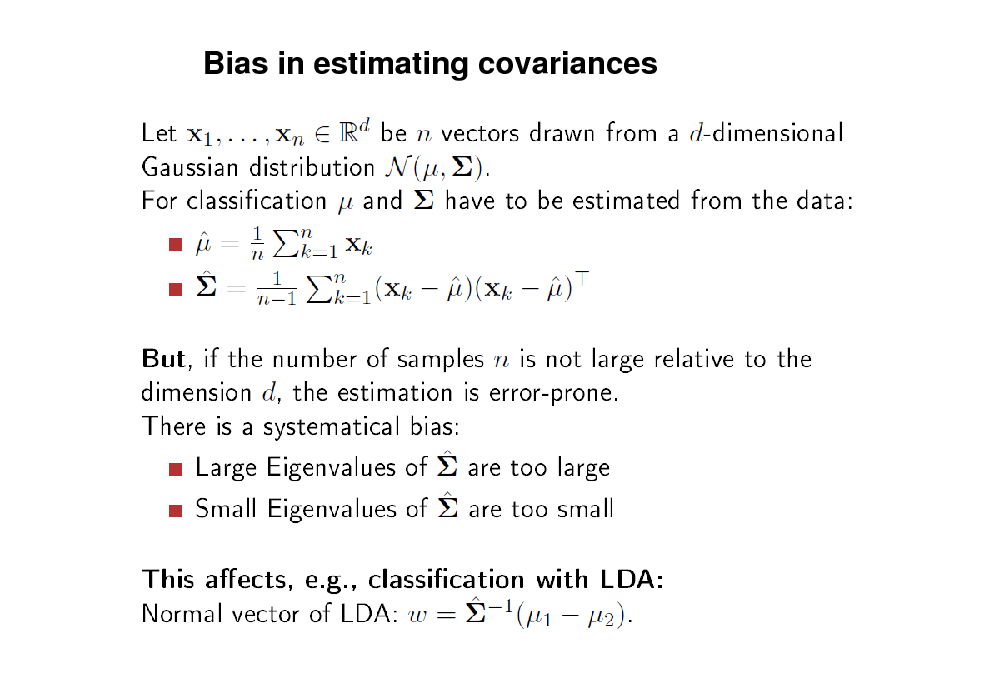
Bias in estimating covariances
120
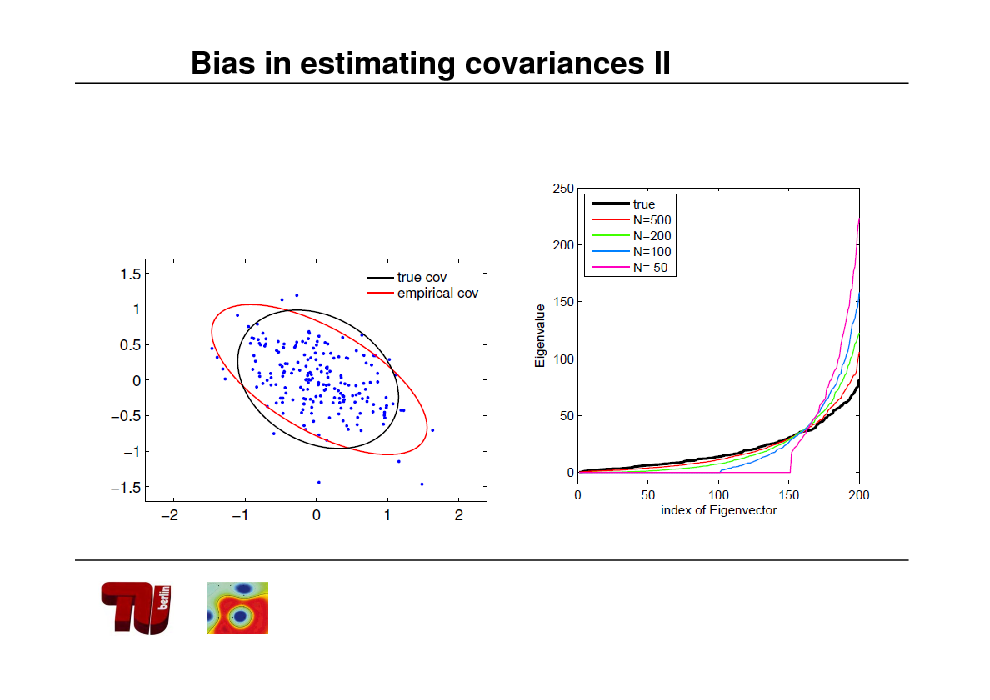
Bias in estimating covariances II
121
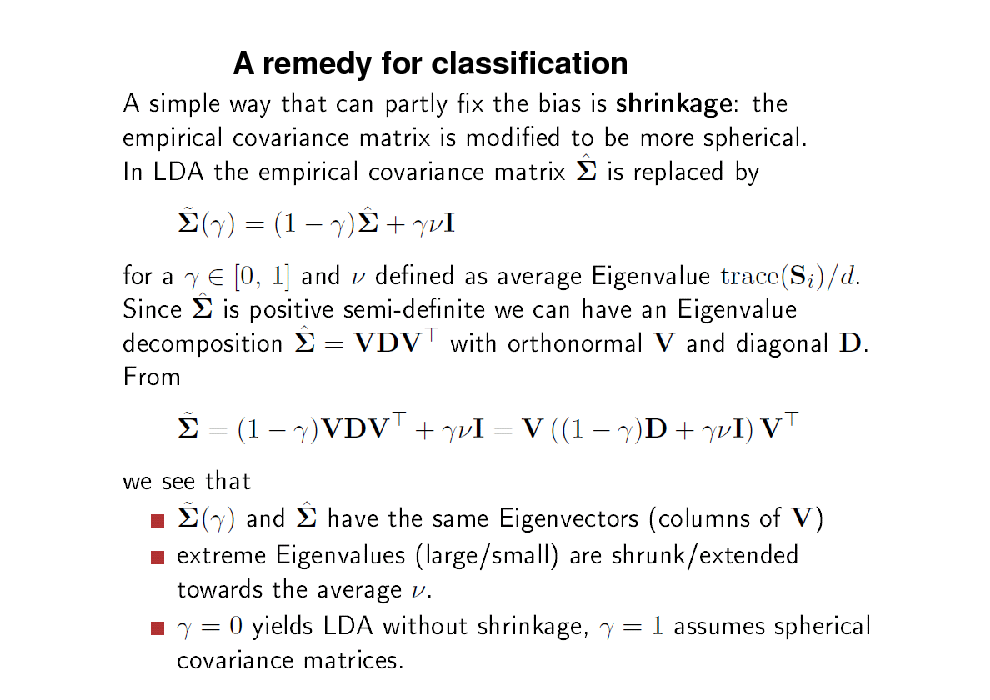
A remedy for classification
122
Modelselection
123
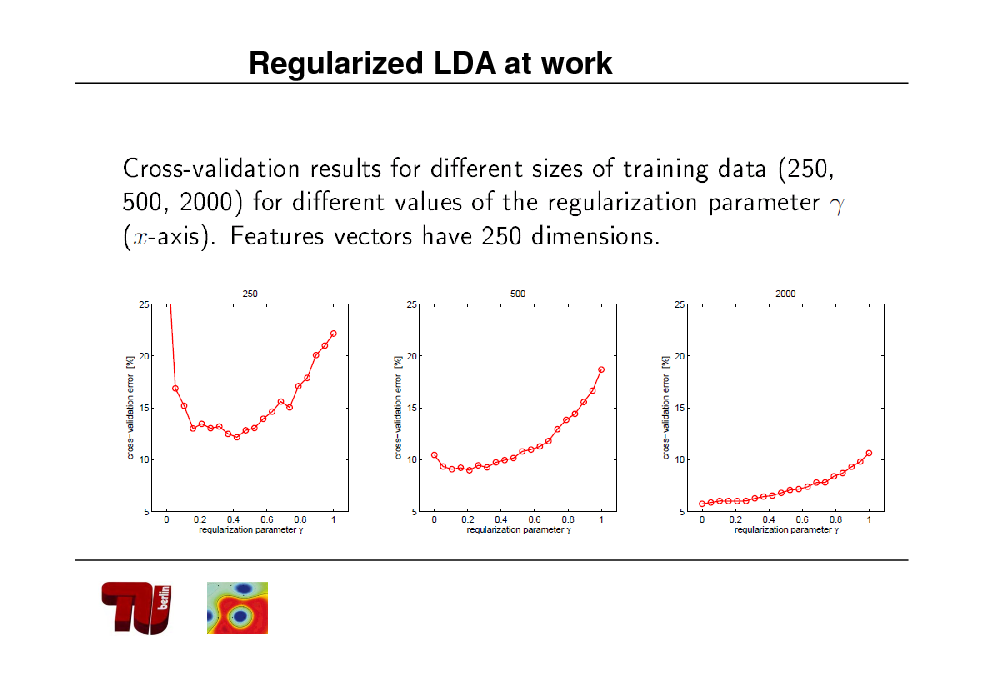
Regularized LDA at work
124
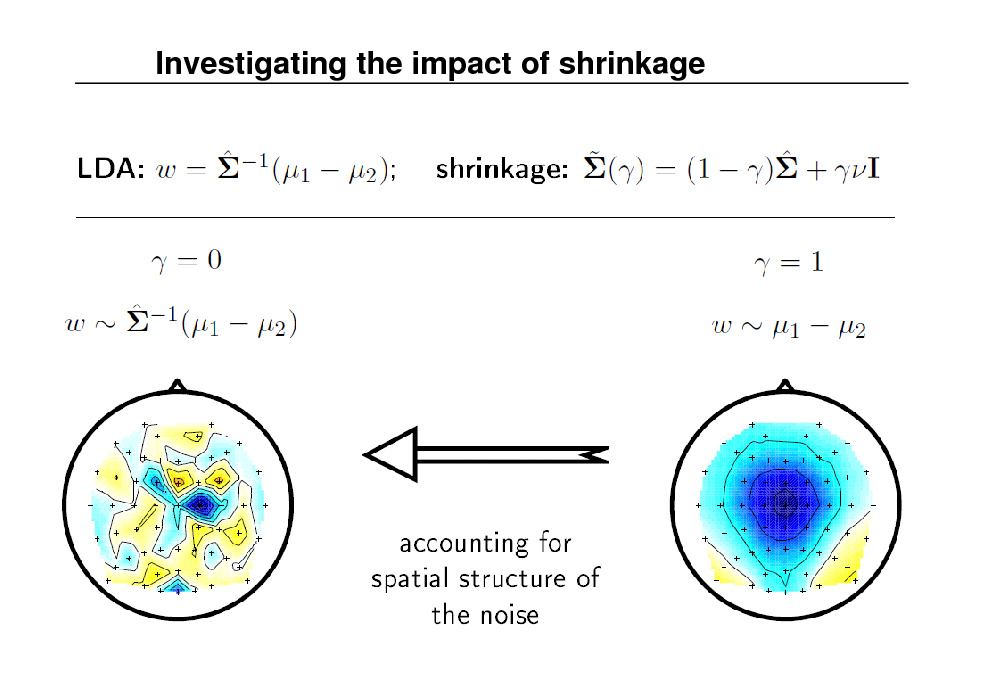
Investigating the impact of shrinkage
125
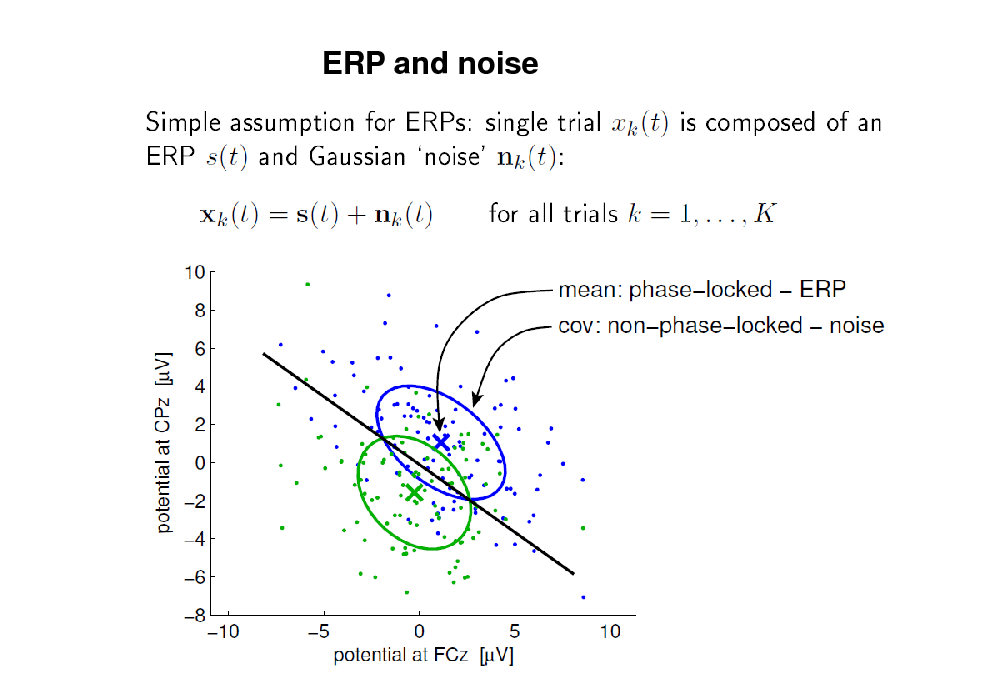
ERP and noise
126
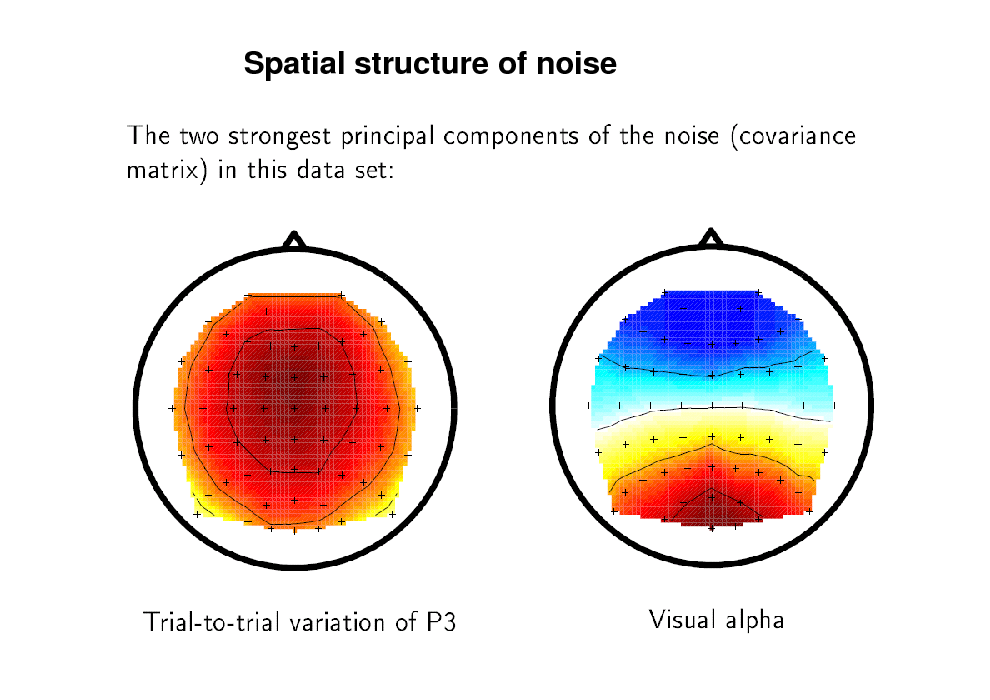
Spatial structure of noise
127
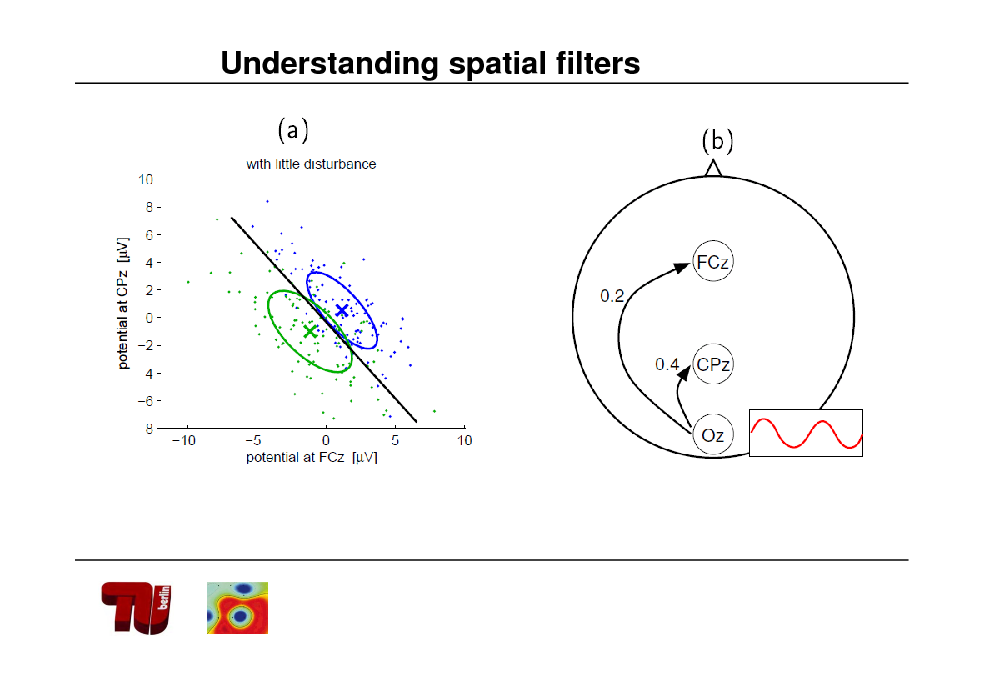
Understanding spatial filters
128
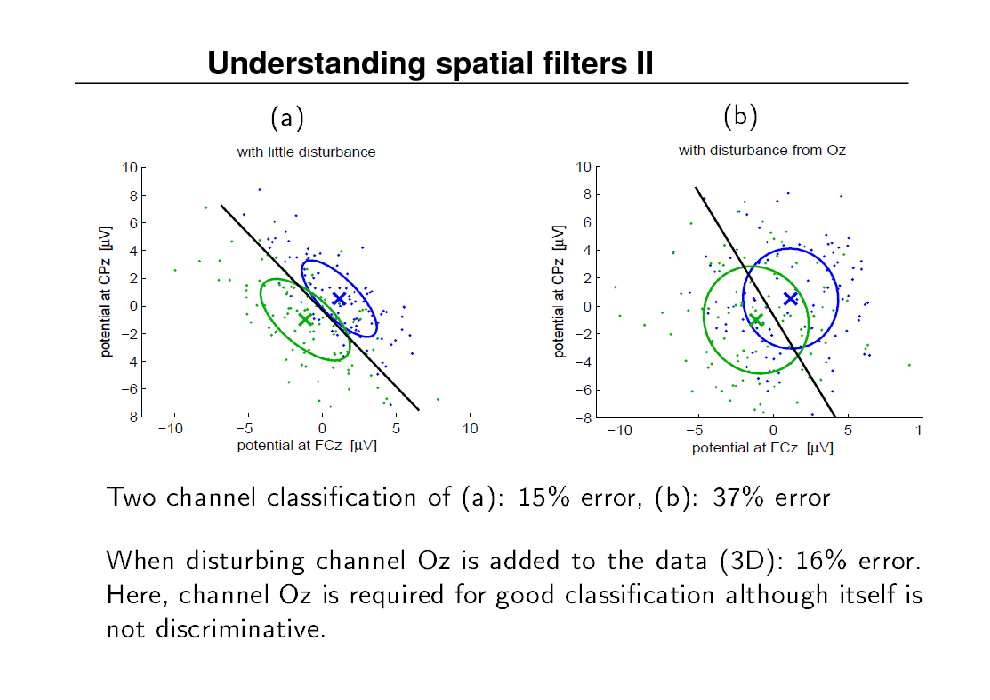
Understanding spatial filters II
129
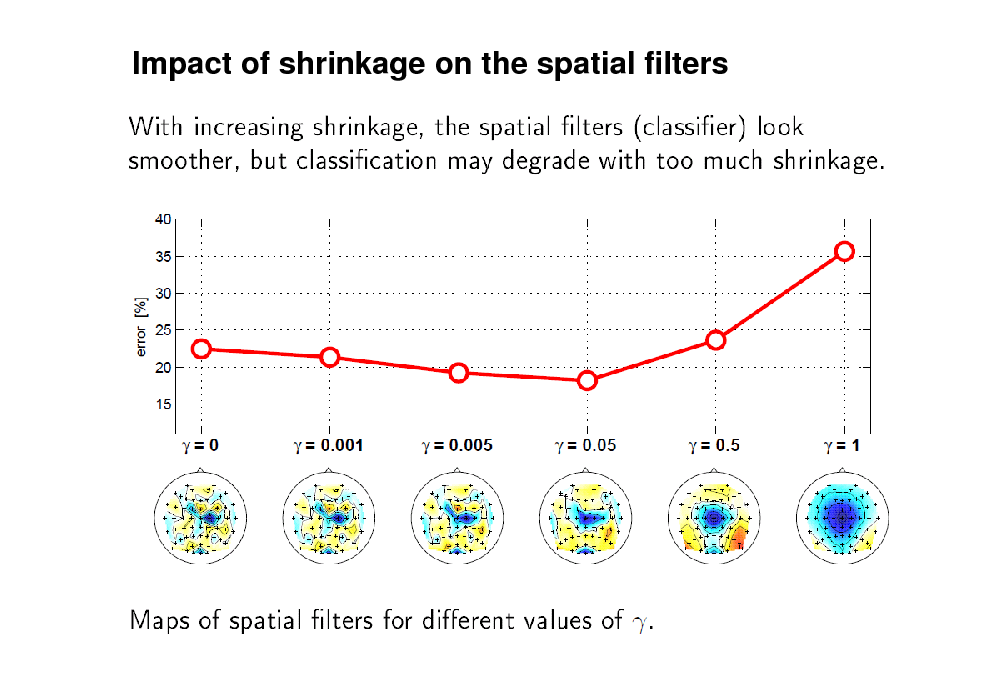
Impact of shrinkage on the spatial filters
130
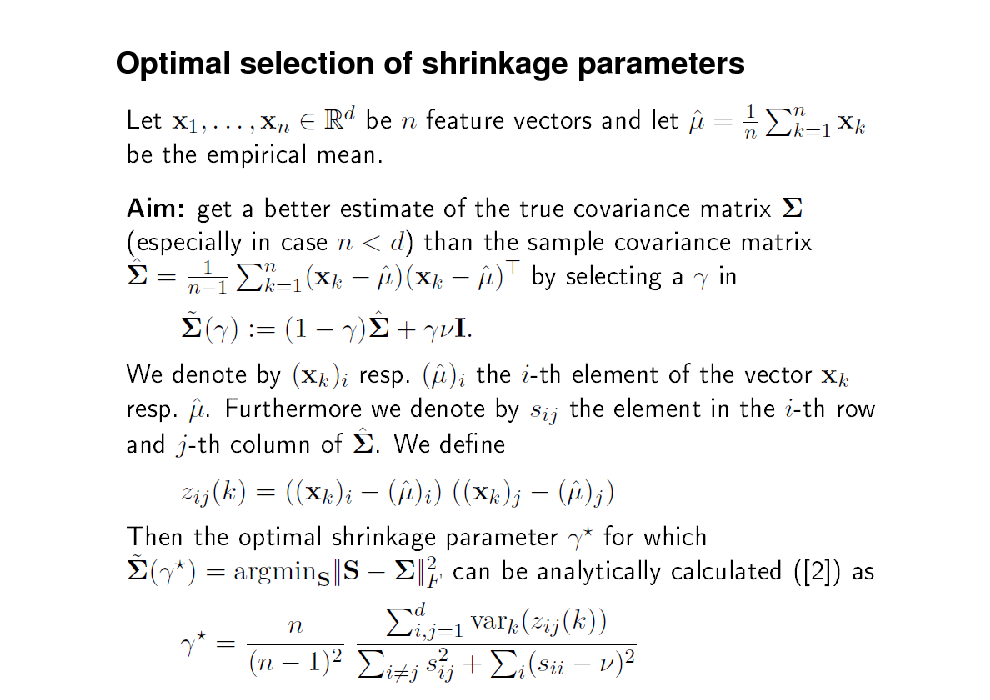
Optimal selection of shrinkage parameters
131
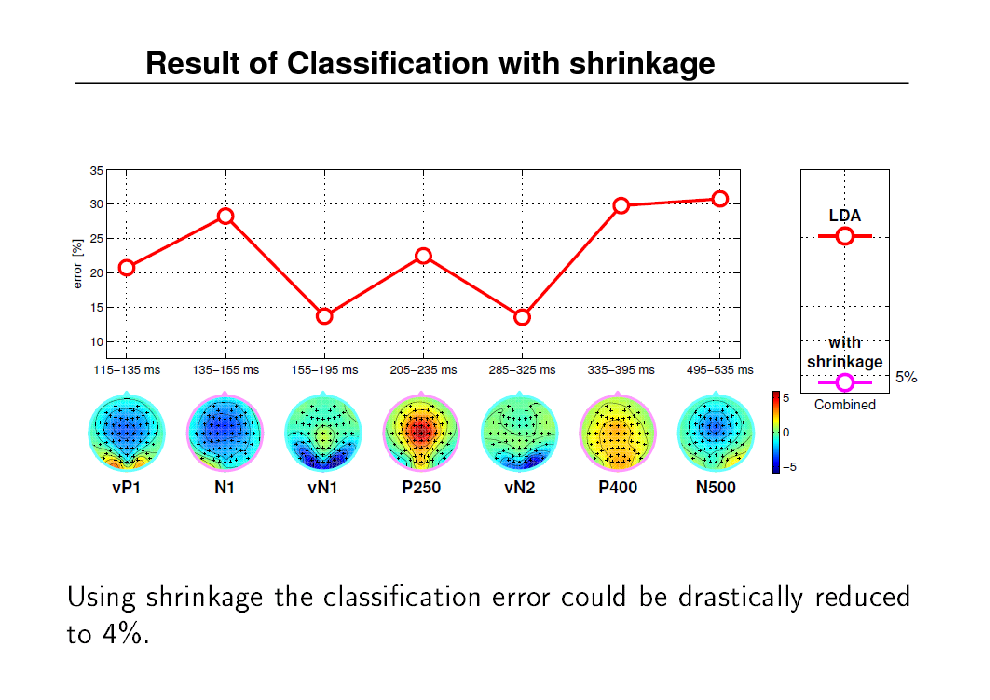
Result of Classification with shrinkage
132
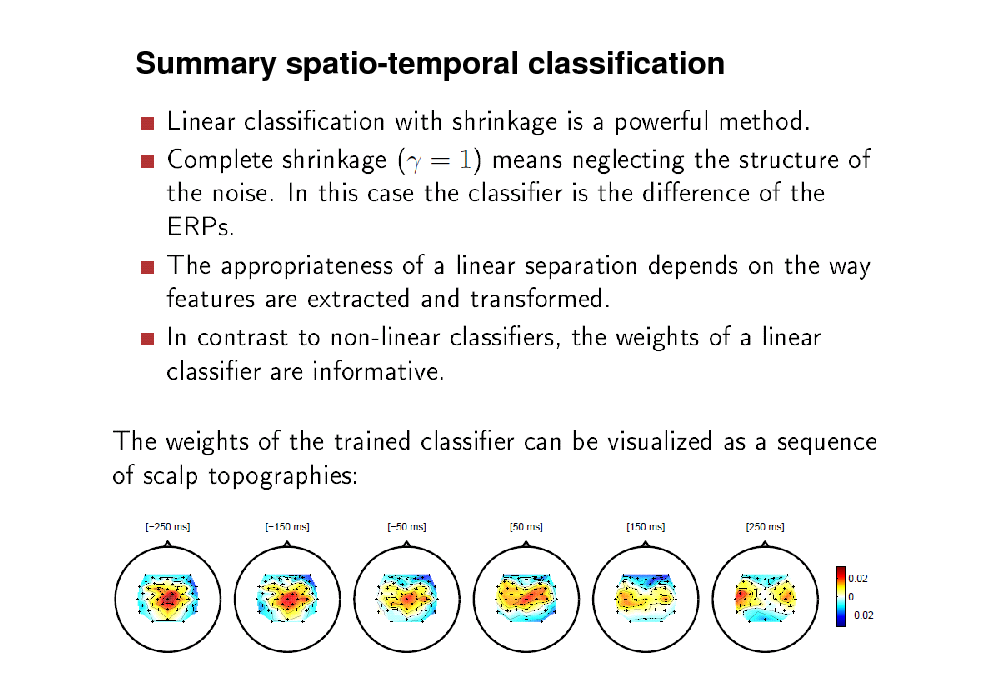
Summary spatio-temporal classification
133

Applications
134
Clinical Applications
135
![Slide: Towards industrial applications of BCI Technology
Technology
[Blankertz et al 2010 Front. Neurosci.]](https://yosinski.com/mlss12/media/slides/MLSS-2012-Muller-Brain-Computer-Interfacing_136.png)
Towards industrial applications of BCI Technology
Technology
[Blankertz et al 2010 Front. Neurosci.]
136
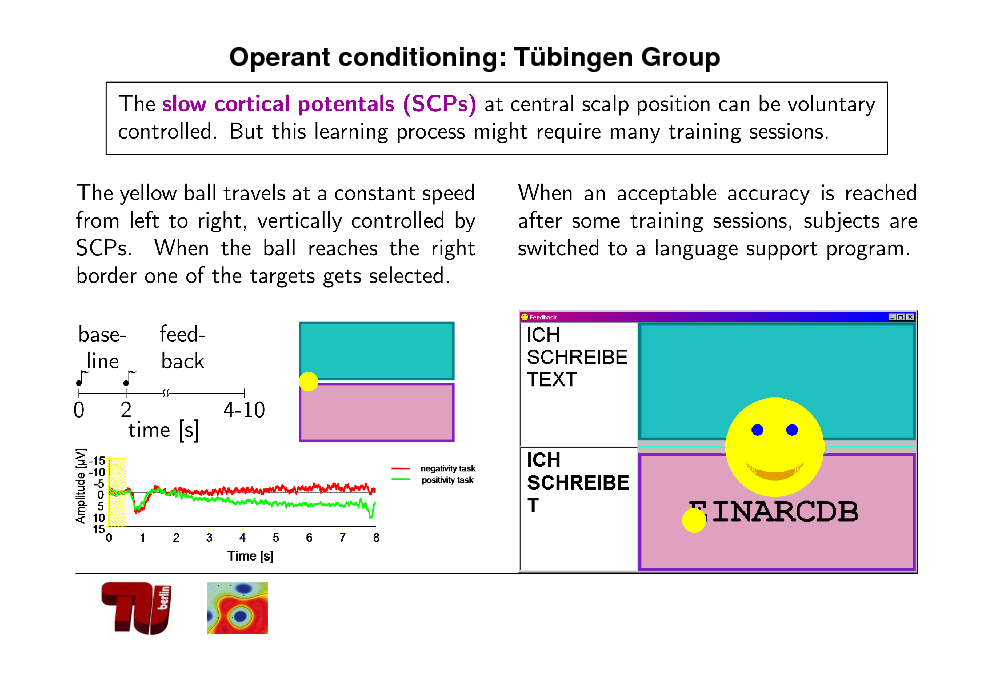
Operant conditioning: Tbingen Group
137
![Slide: Non-Invasive: Tbingen. Birbaumer Lab: Slow Cortical potentials
Negativity task
Positivity task
Amplitude [V]
-15 -10 -5 0 5 10 15
negativity task positivity task
0
1
2
3
4
5
6
7
8
Time [s]
[From Birbaumer et al.]](https://yosinski.com/mlss12/media/slides/MLSS-2012-Muller-Brain-Computer-Interfacing_138.png)
Non-Invasive: Tbingen. Birbaumer Lab: Slow Cortical potentials
Negativity task
Positivity task
Amplitude [V]
-15 -10 -5 0 5 10 15
negativity task positivity task
0
1
2
3
4
5
6
7
8
Time [s]
[From Birbaumer et al.]
138
![Slide: [From Birbaumer et al.]
SCP](https://yosinski.com/mlss12/media/slides/MLSS-2012-Muller-Brain-Computer-Interfacing_139.png)
[From Birbaumer et al.]
SCP
139
![Slide: [From Birbaumer et al.]](https://yosinski.com/mlss12/media/slides/MLSS-2012-Muller-Brain-Computer-Interfacing_140.png)
[From Birbaumer et al.]
140
![Slide: [From Birbaumer et al.]](https://yosinski.com/mlss12/media/slides/MLSS-2012-Muller-Brain-Computer-Interfacing_141.png)
[From Birbaumer et al.]
141

ECOG Decoding
142
![Slide: ECOG
presurgical localization of area causing epilepsy
excellent possibilty to learn about brain for human subject
[From Schalk]](https://yosinski.com/mlss12/media/slides/MLSS-2012-Muller-Brain-Computer-Interfacing_143.png)
ECOG
presurgical localization of area causing epilepsy
excellent possibilty to learn about brain for human subject
[From Schalk]
143
![Slide: Index vs rest Thumb vs rest
[From Schalk]](https://yosinski.com/mlss12/media/slides/MLSS-2012-Muller-Brain-Computer-Interfacing_144.png)
Index vs rest Thumb vs rest
[From Schalk]
144
![Slide: ECOG Analysis
[From Schalk]](https://yosinski.com/mlss12/media/slides/MLSS-2012-Muller-Brain-Computer-Interfacing_145.png)
ECOG Analysis
[From Schalk]
145
fMRI Decoding
146
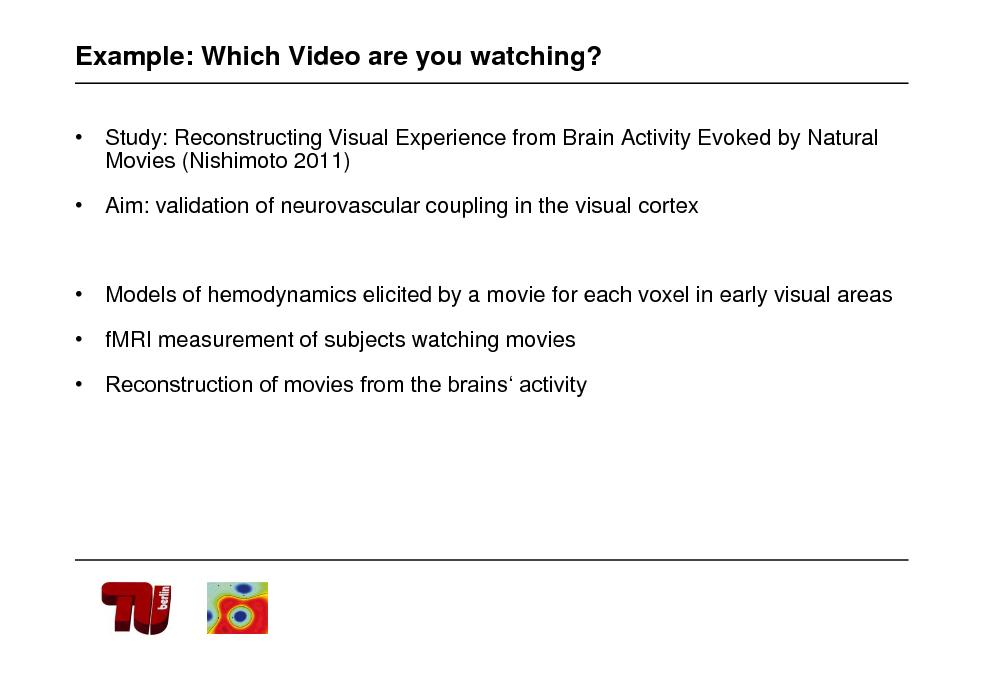
Example: Which Video are you watching?
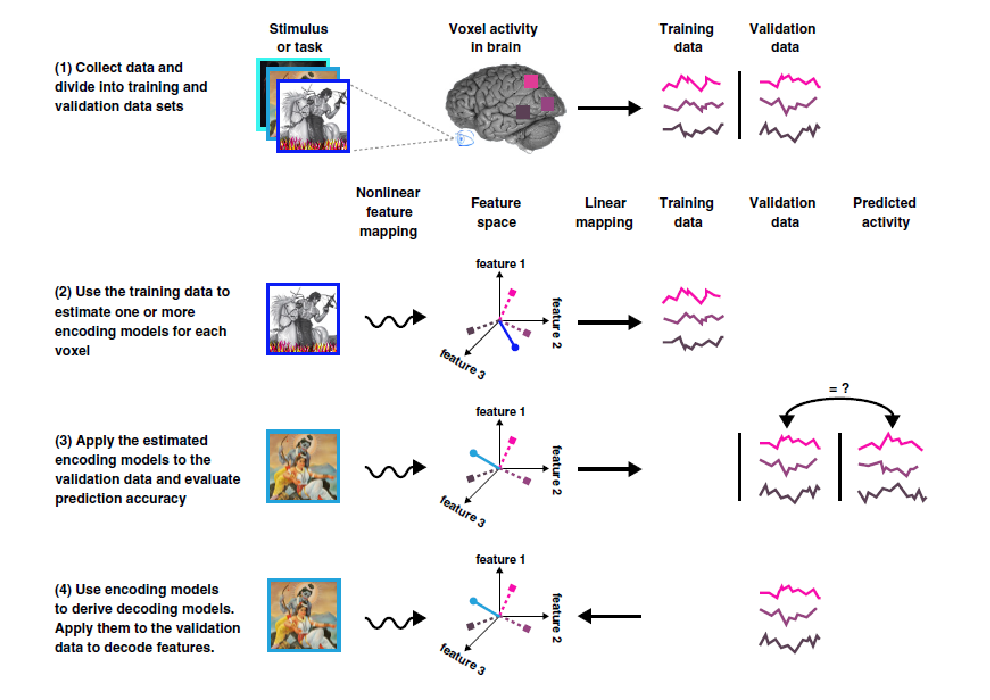
Study: Reconstructing Visual Experience from Brain Activity Evoked by Natural Movies (Nishimoto 2011) Aim: validation of neurovascular coupling in the visual cortex
Models of hemodynamics elicited by a movie for each voxel in early visual areas fMRI measurement of subjects watching movies Reconstruction of movies from the brains activity
147
148
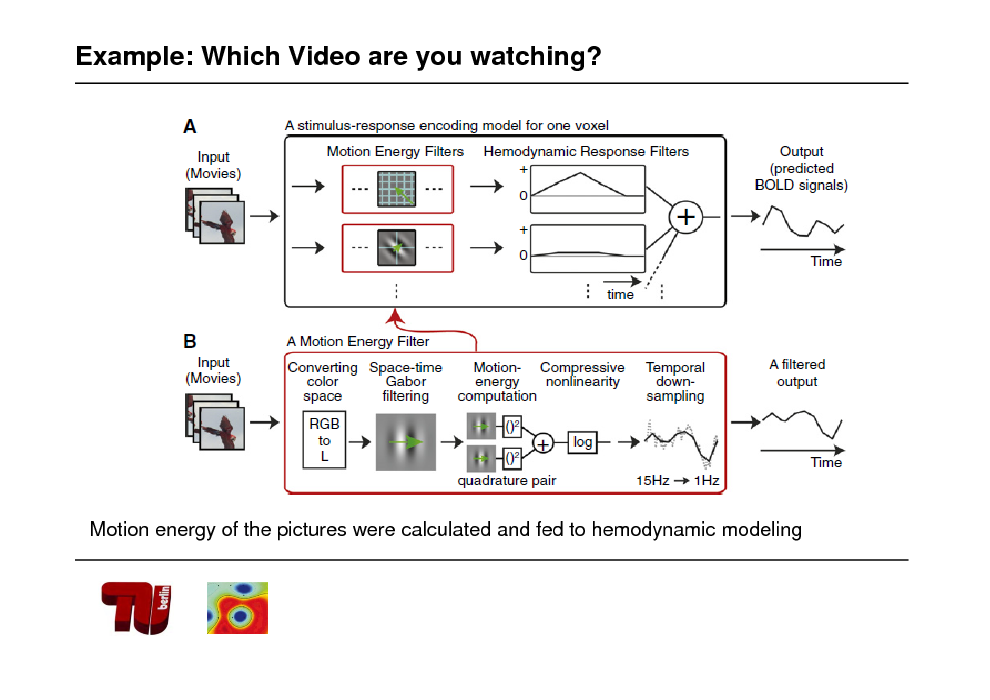
Example: Which Video are you watching?
Motion energy of the pictures were calculated and fed to hemodynamic modeling
149
Example: Which Video are you watching?
Bayesian fit to acquired data of 3 subjects watching 12 movie (each once)
Test the approach on subject watching 9 other movies (each 10 times)
150
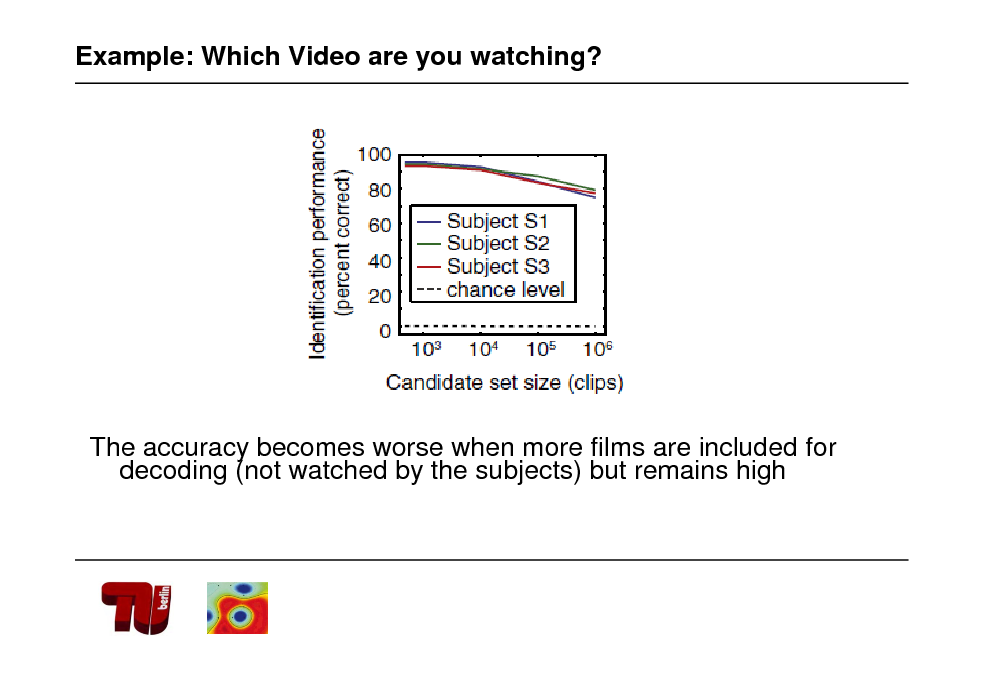
Example: Which Video are you watching?
The accuracy becomes worse when more films are included for decoding (not watched by the subjects) but remains high
151
![Slide: Towards industrial applications of BCI Technology
Technology
[Blankertz et al 2010 Front. Neurosci.]](https://yosinski.com/mlss12/media/slides/MLSS-2012-Muller-Brain-Computer-Interfacing_152.png)
Towards industrial applications of BCI Technology
Technology
[Blankertz et al 2010 Front. Neurosci.]
152
BCI for Assessing Signal Quality perception
153
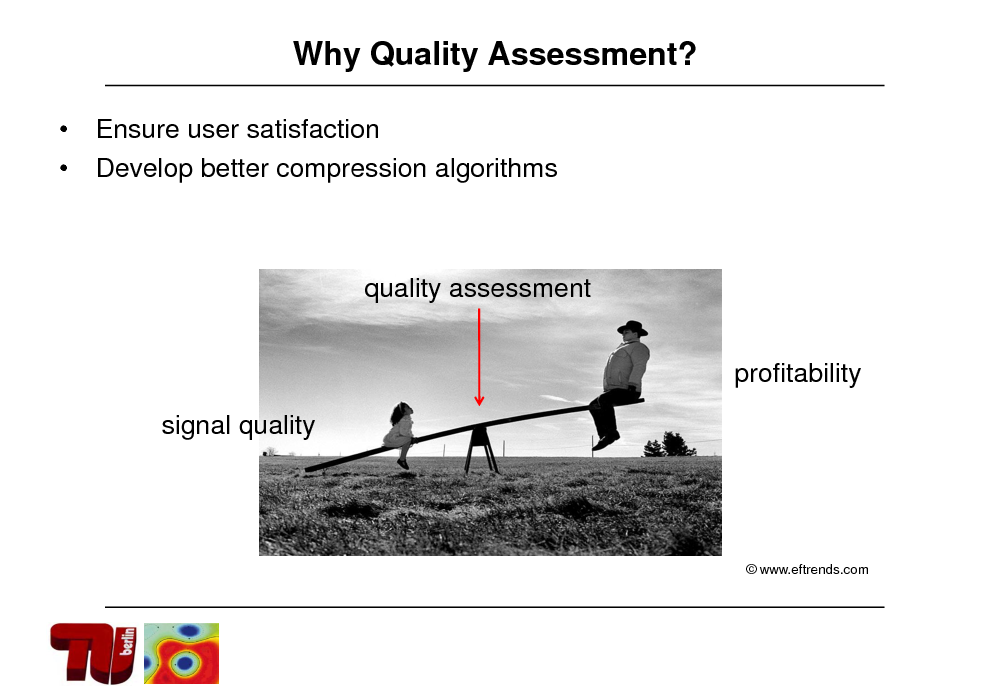
Why Quality Assessment?
Ensure user satisfaction Develop better compression algorithms
quality assessment profitability signal quality
www.eftrends.com
154
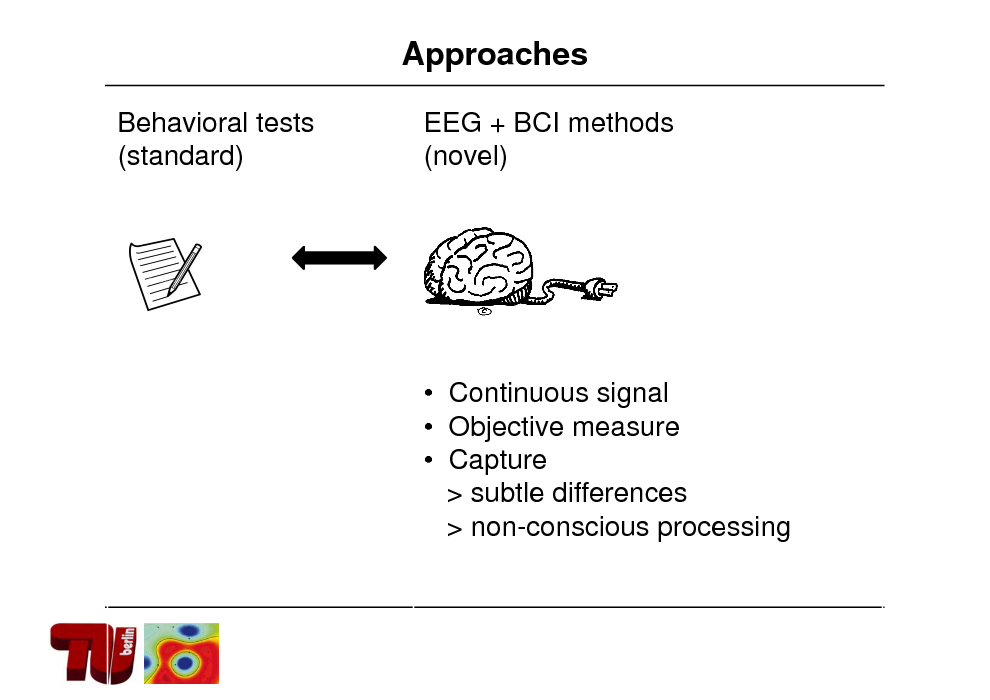
Approaches
Behavioral tests (standard) EEG + BCI methods (novel)
Continuous signal Objective measure Capture > subtle differences > non-conscious processing
155
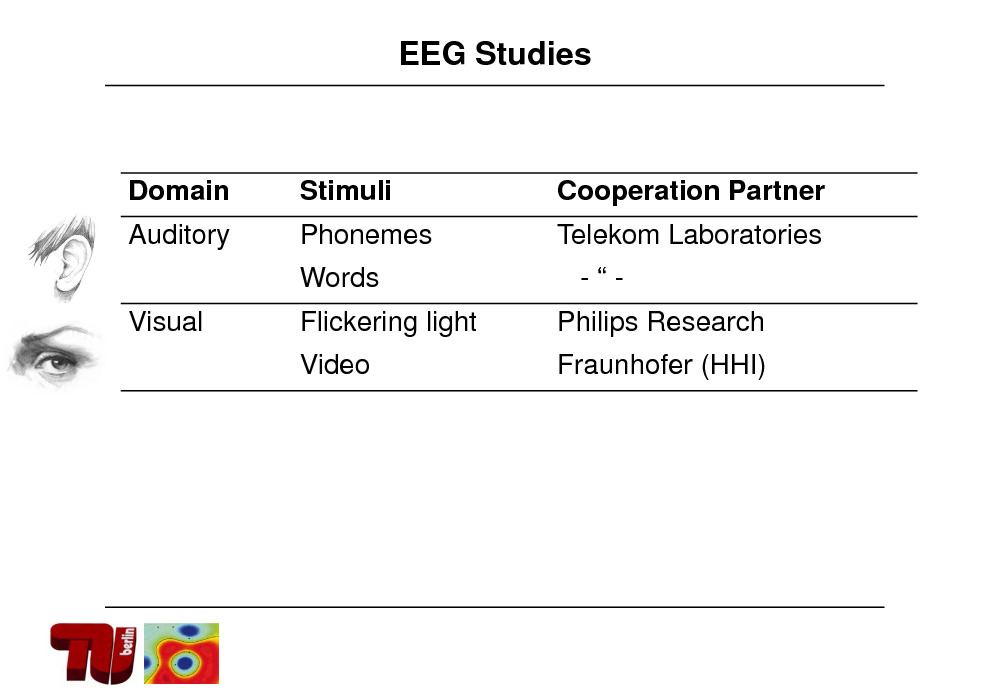
EEG Studies
Domain Auditory Visual
Stimuli Phonemes
Cooperation Partner Telekom Laboratories
Words
Flickering light Video
-Philips Research Fraunhofer (HHI)
156
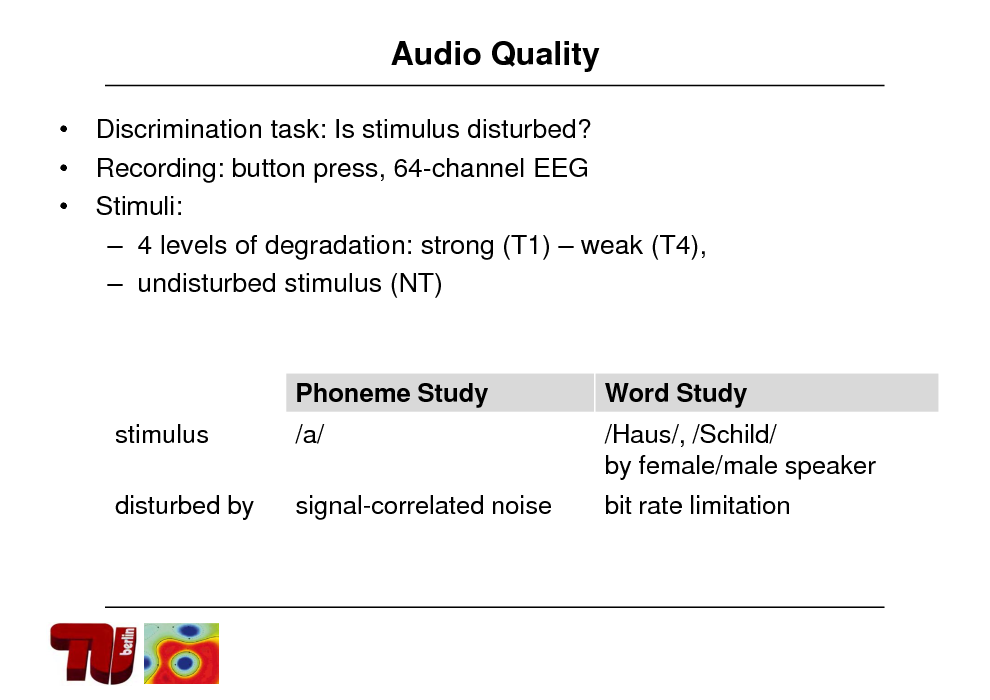
Audio Quality
Discrimination task: Is stimulus disturbed? Recording: button press, 64-channel EEG Stimuli: 4 levels of degradation: strong (T1) weak (T4), undisturbed stimulus (NT)
Phoneme Study stimulus disturbed by /a/ signal-correlated noise
Word Study /Haus/, /Schild/ by female/male speaker bit rate limitation
157
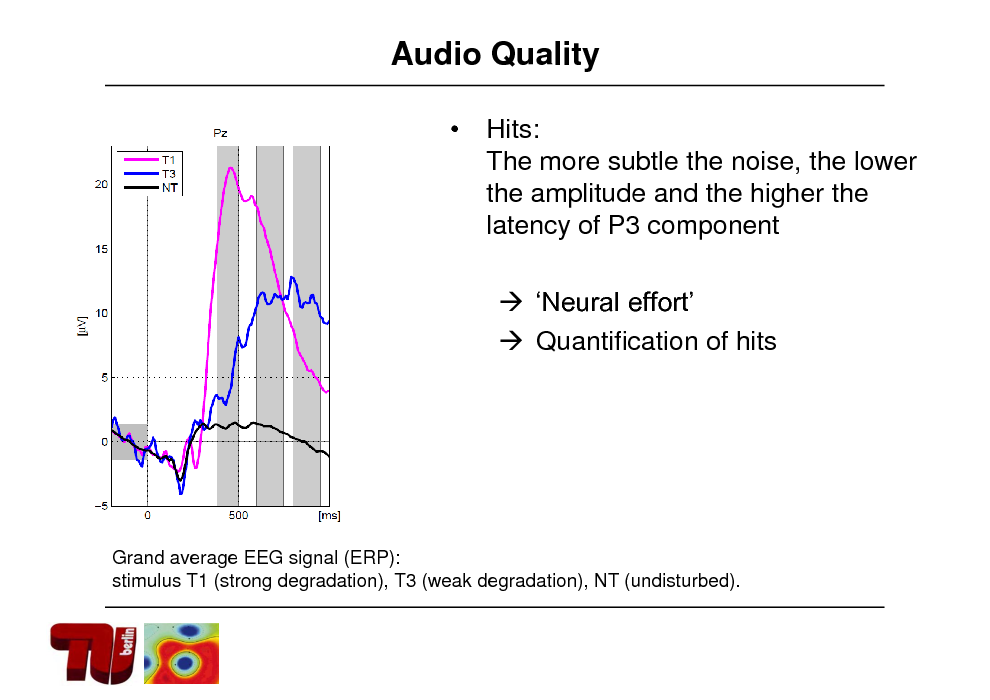
Audio Quality
Hits: The more subtle the noise, the lower the amplitude and the higher the latency of P3 component Neural effort Quantification of hits
Grand average EEG signal (ERP): stimulus T1 (strong degradation), T3 (weak degradation), NT (undisturbed).
158
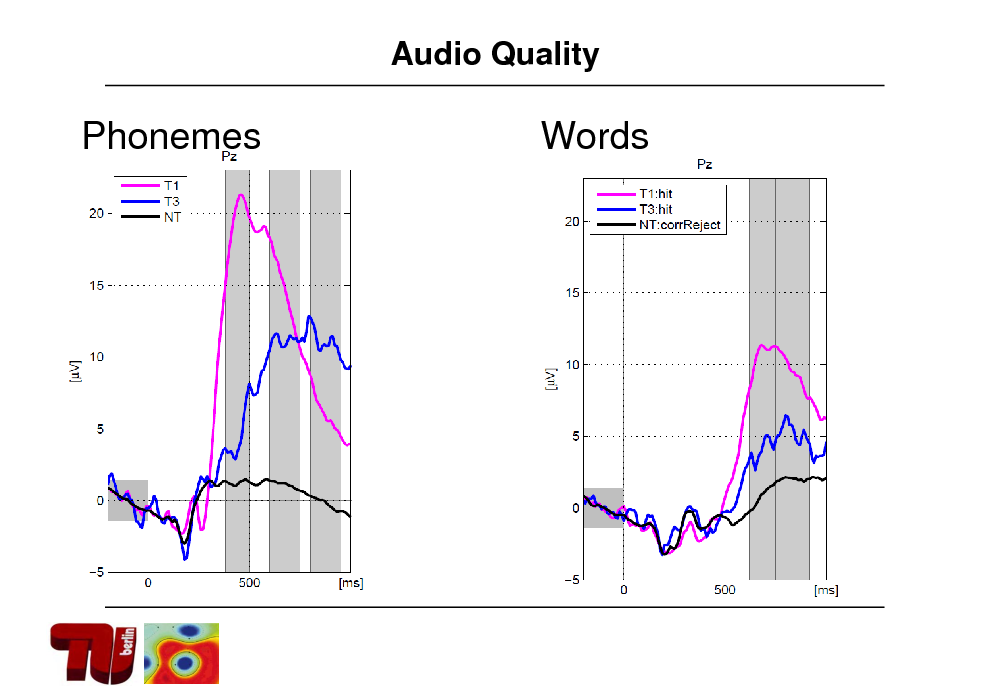
Audio Quality
Phonemes
Words
159
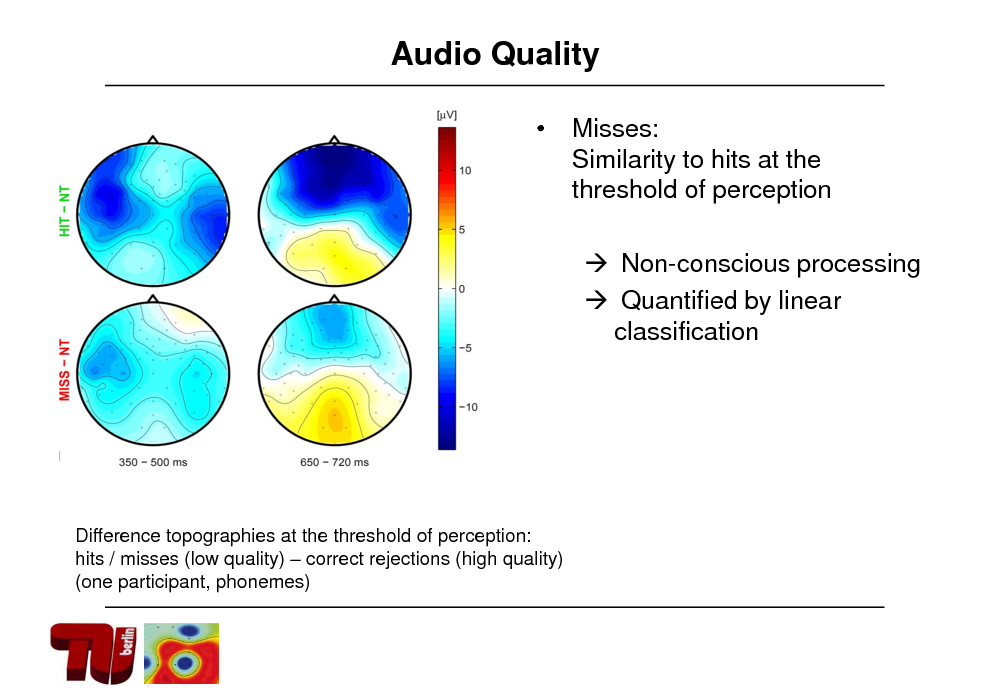
Audio Quality
Misses: Similarity to hits at the threshold of perception Non-conscious processing Quantified by linear classification
Difference topographies at the threshold of perception: hits / misses (low quality) correct rejections (high quality) (one participant, phonemes)
160
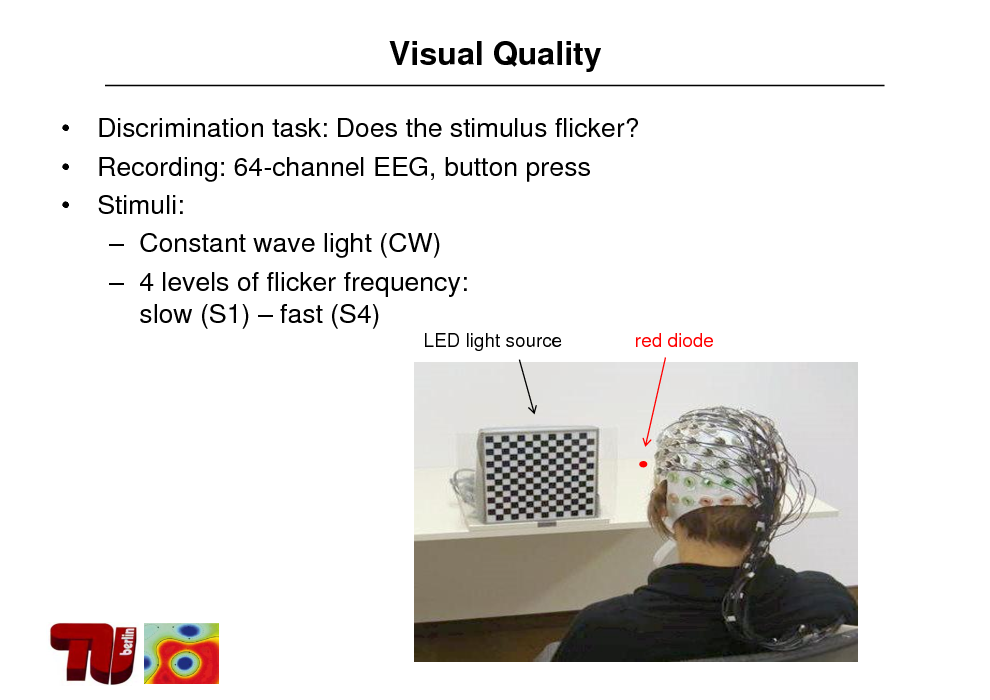
Visual Quality
Discrimination task: Does the stimulus flicker? Recording: 64-channel EEG, button press Stimuli: Constant wave light (CW) 4 levels of flicker frequency: slow (S1) fast (S4)
LED light source red diode
161
![Slide: Visual Quality
Added value of EEG
Stimulation frequencies [Hz] per participant; colored cells: significant neural response
- Orange: shown by EEG (t-test, univariate)](https://yosinski.com/mlss12/media/slides/MLSS-2012-Muller-Brain-Computer-Interfacing_162.png)
Visual Quality
Added value of EEG
Stimulation frequencies [Hz] per participant; colored cells: significant neural response
- Orange: shown by EEG (t-test, univariate)
162
![Slide: Visual Quality
Added value of EEG and ML
Stimulation frequencies [Hz] per participant; colored cells: significant neural response
- Yellow + orange: shown by ML (CSP+LDA, multivariate)](https://yosinski.com/mlss12/media/slides/MLSS-2012-Muller-Brain-Computer-Interfacing_163.png)
Visual Quality
Added value of EEG and ML
Stimulation frequencies [Hz] per participant; colored cells: significant neural response
- Yellow + orange: shown by ML (CSP+LDA, multivariate)
163
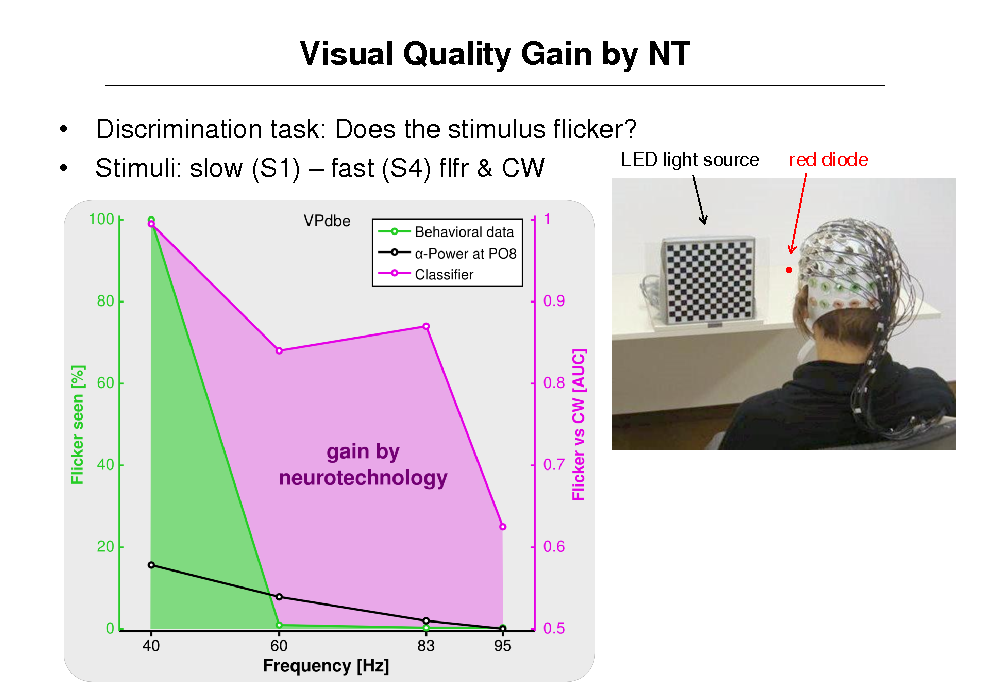
Visual Quality Gain by NT
Discrimination task: Does the stimulus flicker? LED light source Stimuli: slow (S1) fast (S4) flfr & CW
red diode
164
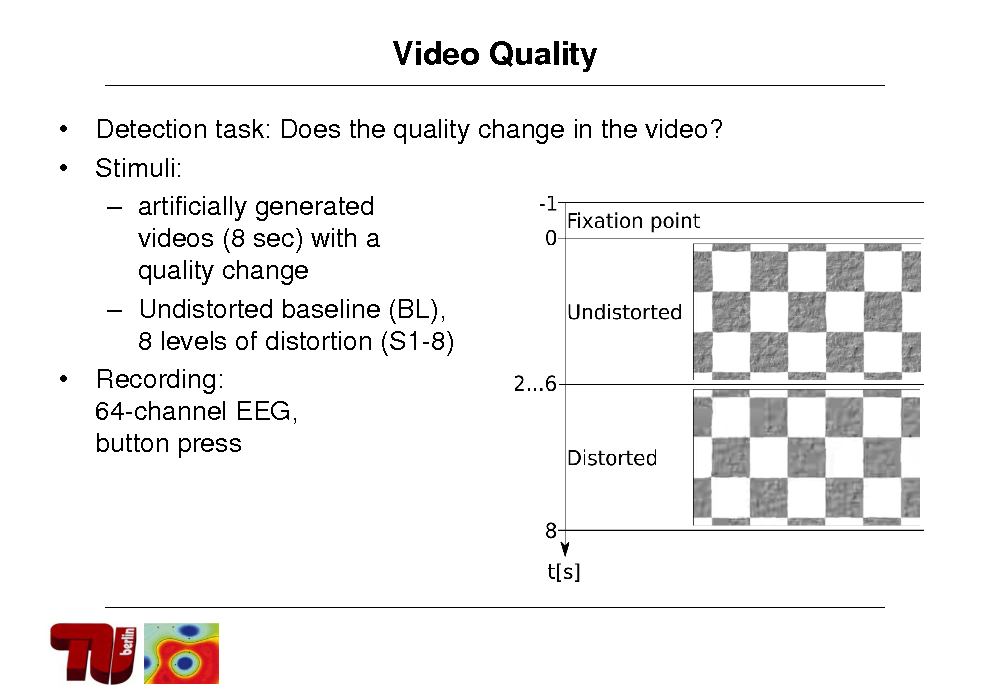
Video Quality
Detection task: Does the quality change in the video? Stimuli: artificially generated videos (8 sec) with a quality change Undistorted baseline (BL), 8 levels of distortion (S1-8) Recording: 64-channel EEG, button press
165
Video Quality
166
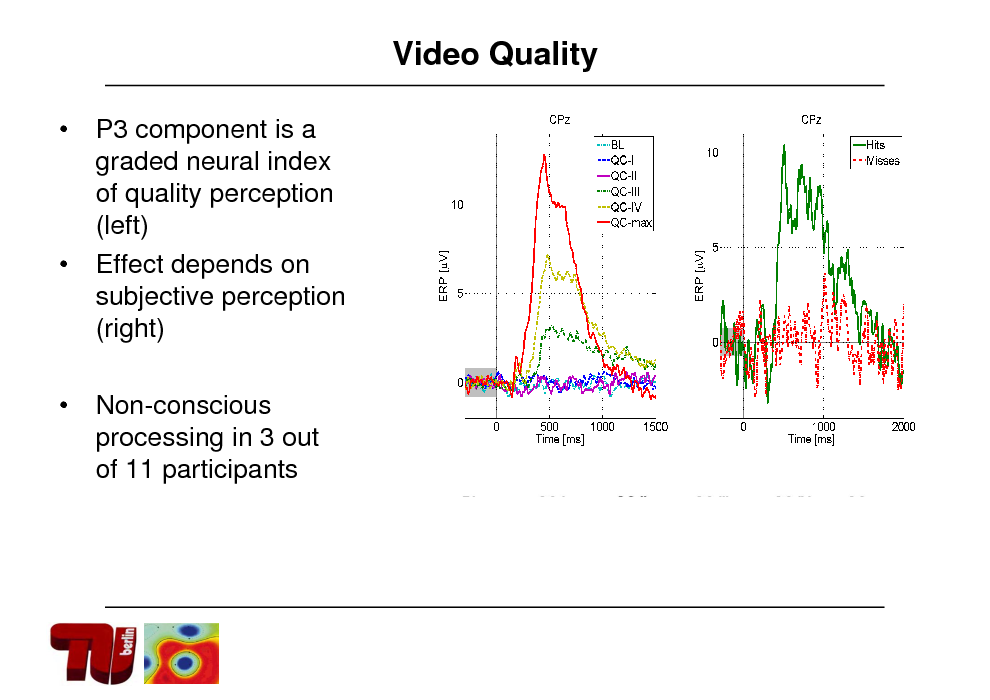
Video Quality
P3 component is a graded neural index of quality perception (left) Effect depends on subjective perception (right) Non-conscious processing in 3 out of 11 participants
167
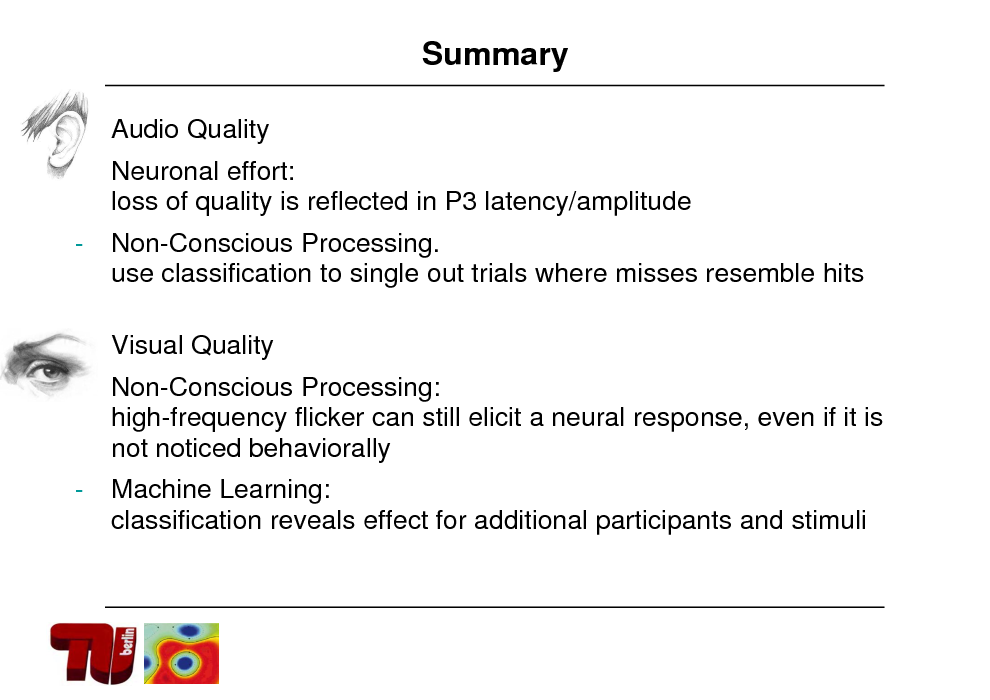
Summary
Audio Quality Neuronal effort: loss of quality is reflected in P3 latency/amplitude
-
Non-Conscious Processing. use classification to single out trials where misses resemble hits
Visual Quality Non-Conscious Processing: high-frequency flicker can still elicit a neural response, even if it is not noticed behaviorally
-
-
Machine Learning: classification reveals effect for additional participants and stimuli
168

BCI for Assessing Workload
169
![Slide: Nonclinical Application: tiredness monitoring
[Kohlmorgen, Mller et al 2007]](https://yosinski.com/mlss12/media/slides/MLSS-2012-Muller-Brain-Computer-Interfacing_170.png)
Nonclinical Application: tiredness monitoring
[Kohlmorgen, Mller et al 2007]
170
![Slide: Application: Cognitive workload and drowsyness assessment
Assess workload with BCI and balance it by smart driver assistent system
Assess cognitive alertness
[Kohlmorgen, Mller et al 2007]](https://yosinski.com/mlss12/media/slides/MLSS-2012-Muller-Brain-Computer-Interfacing_171.png)
Application: Cognitive workload and drowsyness assessment
Assess workload with BCI and balance it by smart driver assistent system
Assess cognitive alertness
[Kohlmorgen, Mller et al 2007]
171

BCI for Assessing Upcoming decisions
172
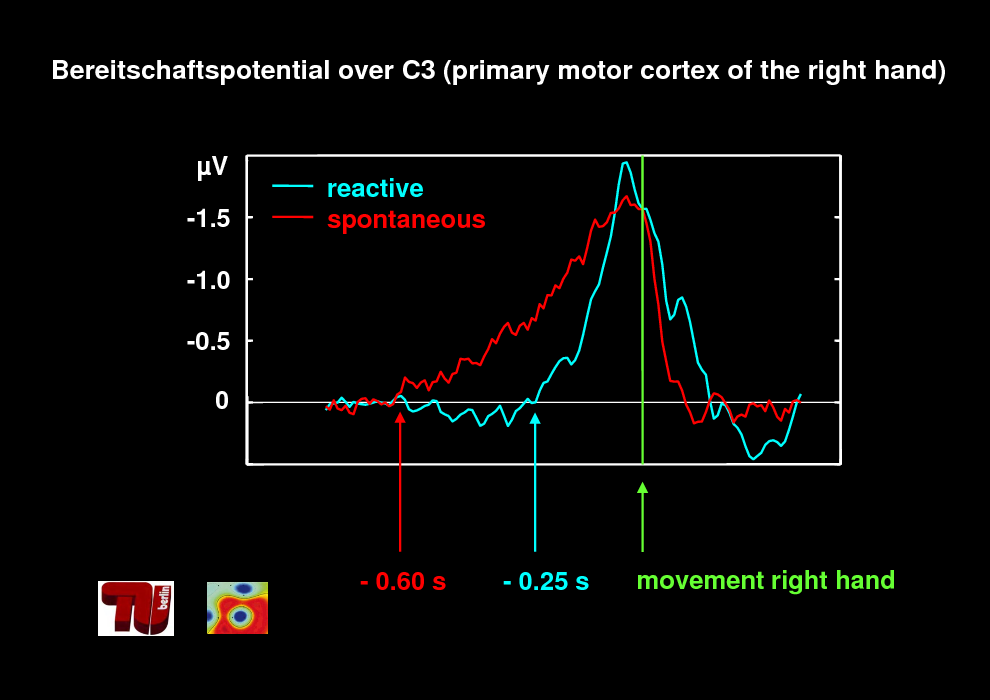
Bereitschaftspotential over C3 (primary motor cortex of the right hand)
V -1.5 -1.0 -0.5 0
reactive spontaneous
- 0.60 s
- 0.25 s
movement right hand
173
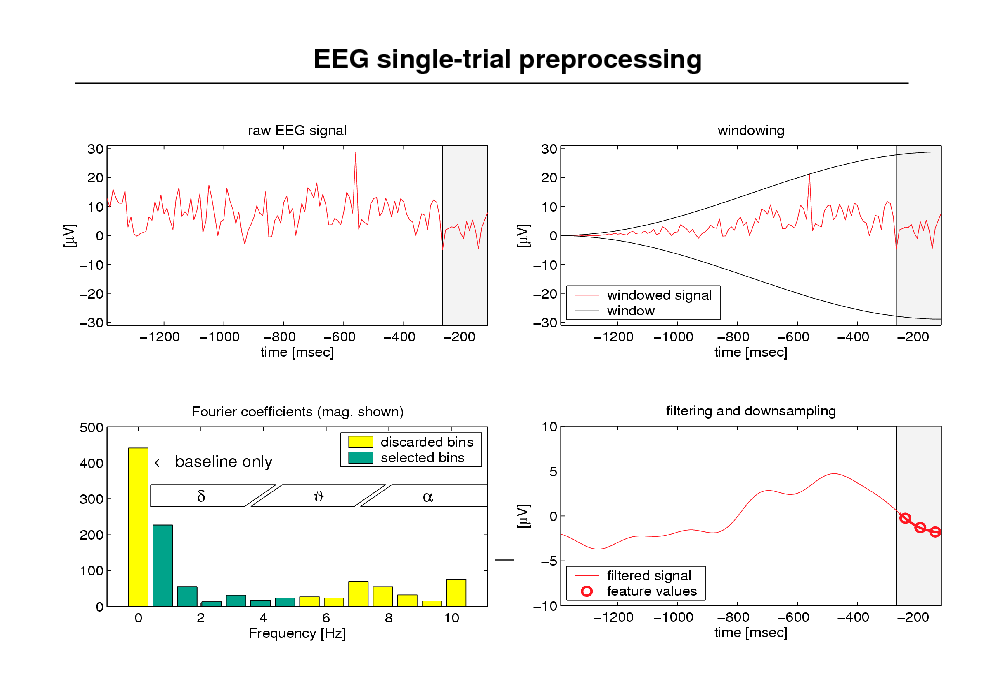
EEG single-trial preprocessing
174
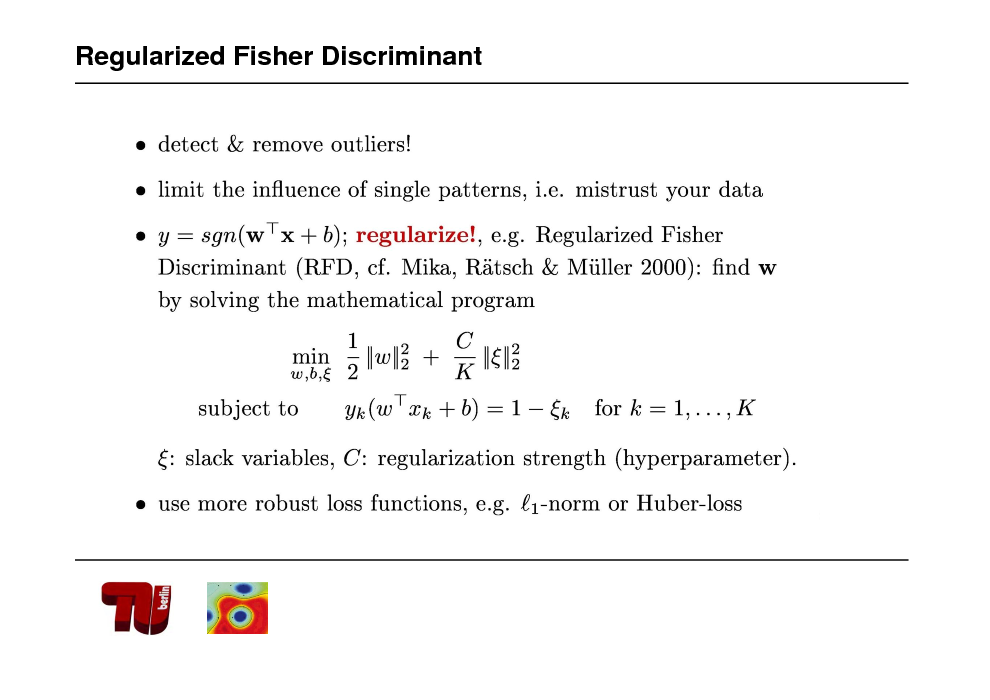
Regularized Fisher Discriminant
175
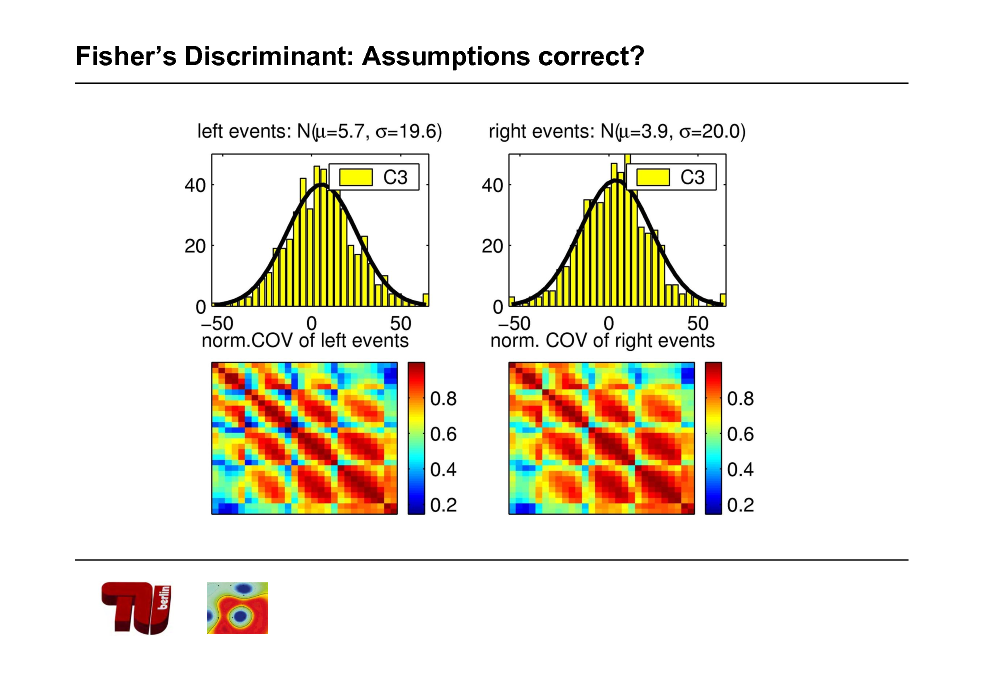
Fishers Discriminant: Assumptions correct?
176
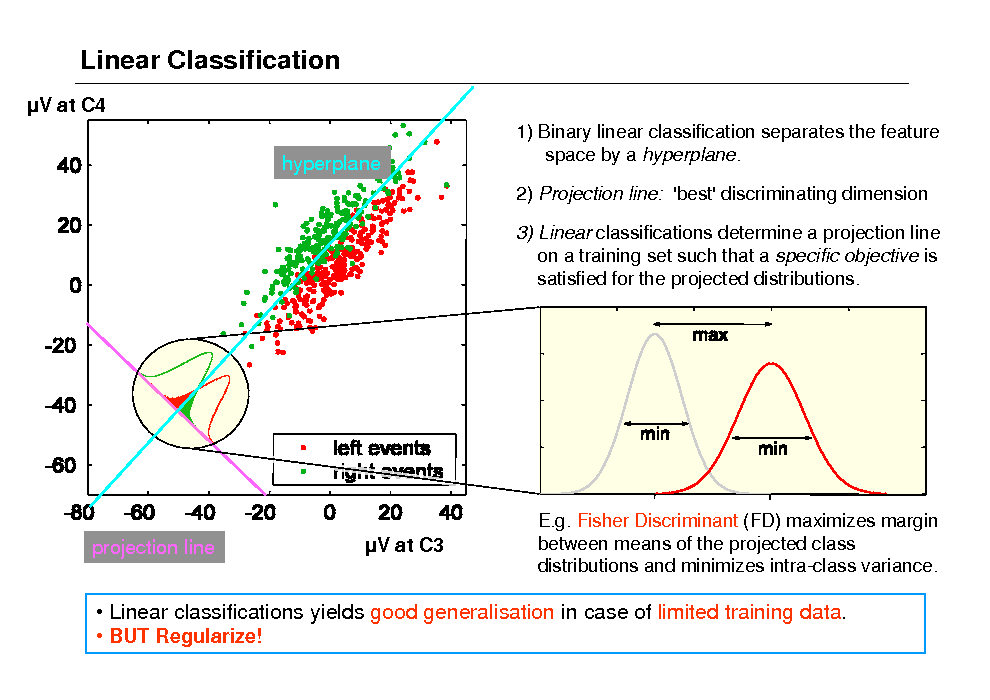
Linear Classification
V at C4 hyperplane
1) Binary linear classification separates the feature space by a hyperplane. 2) Projection line: 'best' discriminating dimension 3) Linear classifications determine a projection line on a training set such that a specific objective is satisfied for the projected distributions.
projection line
V at C3
E.g. Fisher Discriminant (FD) maximizes margin between means of the projected class distributions and minimizes intra-class variance.
Linear classifications yields good generalisation in case of limited training data.
BUT Regularize!
177
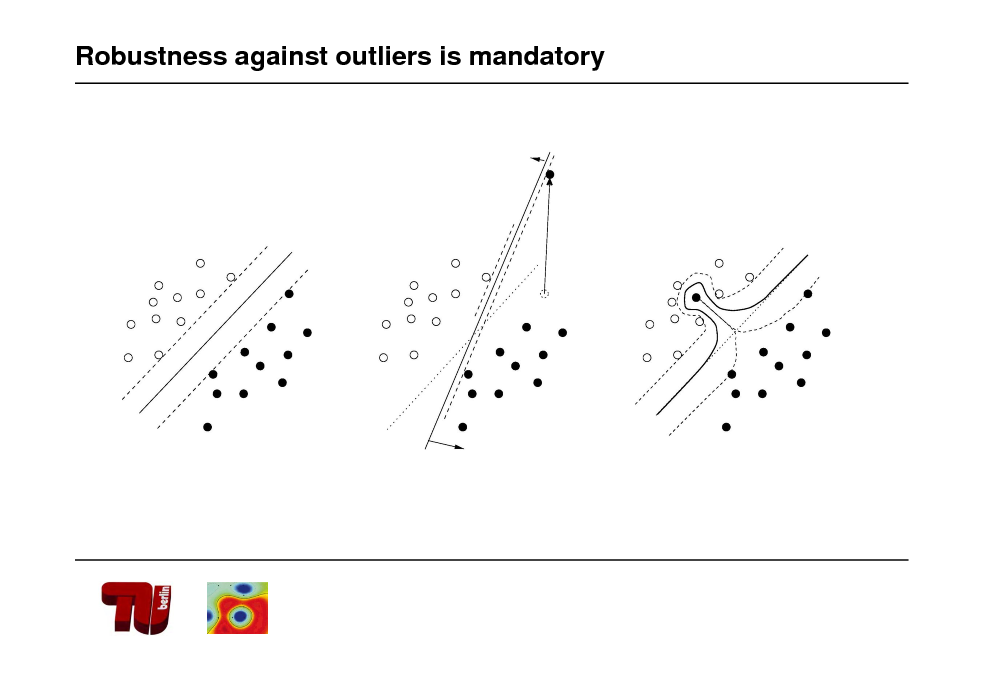
Robustness against outliers is mandatory
178
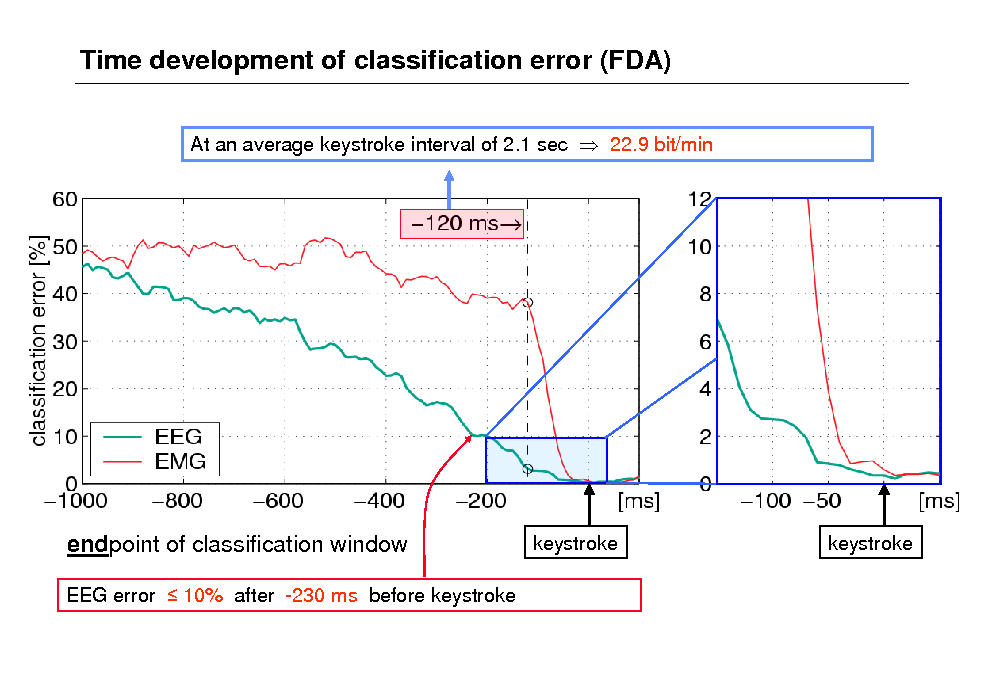
Time development of classification error (FDA)
At an average keystroke interval of 2.1 sec 22.9 bit/min
endpoint of classification window
EEG error 10% after -230 ms before keystroke
keystroke
keystroke
179
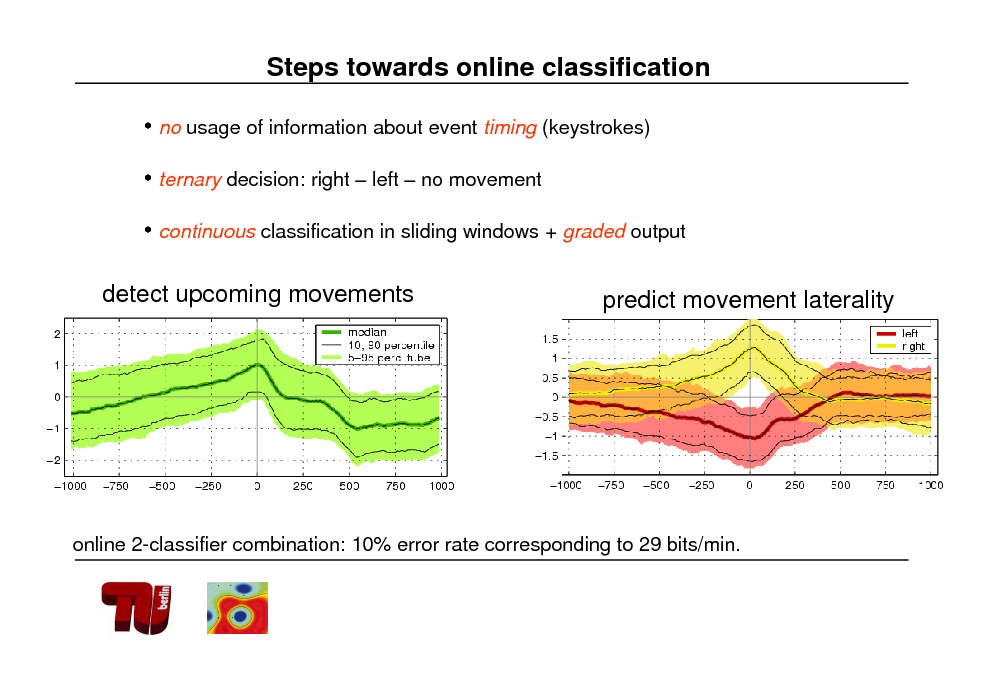
Steps towards online classification
no usage of information about event timing (keystrokes) ternary decision: right left no movement
continuous classification in sliding windows + graded output detect upcoming movements predict movement laterality
online 2-classifier combination: 10% error rate corresponding to 29 bits/min.
180

181
182
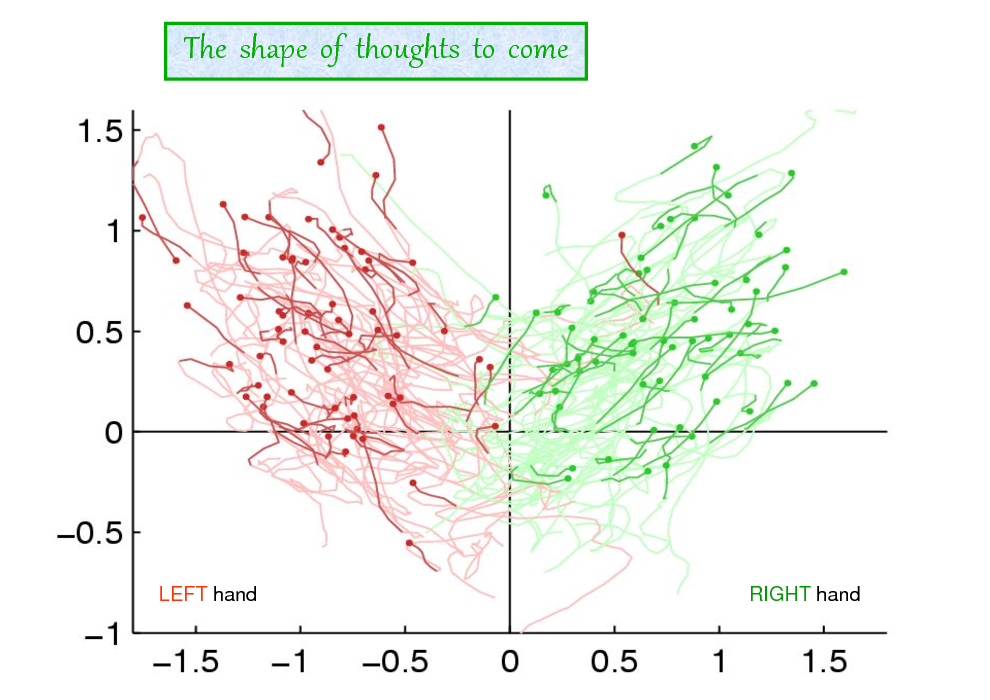
The shape of thoughts to come
LEFT hand
RIGHT hand
183
![Slide: Study: emergency breaking in driving simulator
- Highly specific sequence of EEG potentials 500 ms before breaking 1) Perception of breaklight stimulus (visual evoked potentials) 2) Identification of emergency (P300 component) 3) Preparation of breaking movement (Bereitschaftspotential) - EEG (+EMG) features improve the pedal based breaking detector by 150 ms
- 4 m less breaking space at speed100 km/h
[Haufe et al., EEG potentials predict upcoming emergency brakings during simulated driving. J Neural Eng. 2011]](https://yosinski.com/mlss12/media/slides/MLSS-2012-Muller-Brain-Computer-Interfacing_184.png)
Study: emergency breaking in driving simulator
- Highly specific sequence of EEG potentials 500 ms before breaking 1) Perception of breaklight stimulus (visual evoked potentials) 2) Identification of emergency (P300 component) 3) Preparation of breaking movement (Bereitschaftspotential) - EEG (+EMG) features improve the pedal based breaking detector by 150 ms
- 4 m less breaking space at speed100 km/h
[Haufe et al., EEG potentials predict upcoming emergency brakings during simulated driving. J Neural Eng. 2011]
184

185
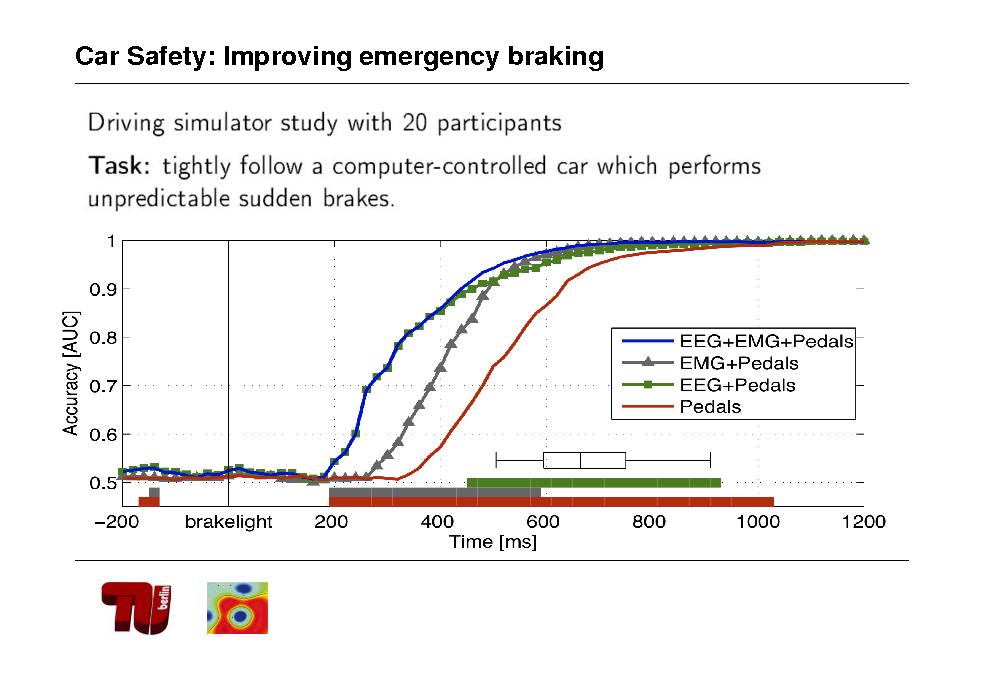
Car Safety: Improving emergency braking
186
Conclusion
BBCI: Untrained, Calibration < 10min, data analysis <<5min, BCI experiment
5-8 letters/min mental typewriter CeBit 06,10. Brain2Robot@Medica 07, lNdW 09 Machine Learning and modern data analysis is of central importance for BCI et al Important issue of this talk: How to learn under nonstationarity? Solutions: SSA, i.e. project on stationary subspace and learn there, linear, sound & fast Modeling: covariate shift based CV: special mixed effects model co-adaptation, Multimodal tracking, invariant features etc
FOR INFORMATION SEE: www.bbci.de
187
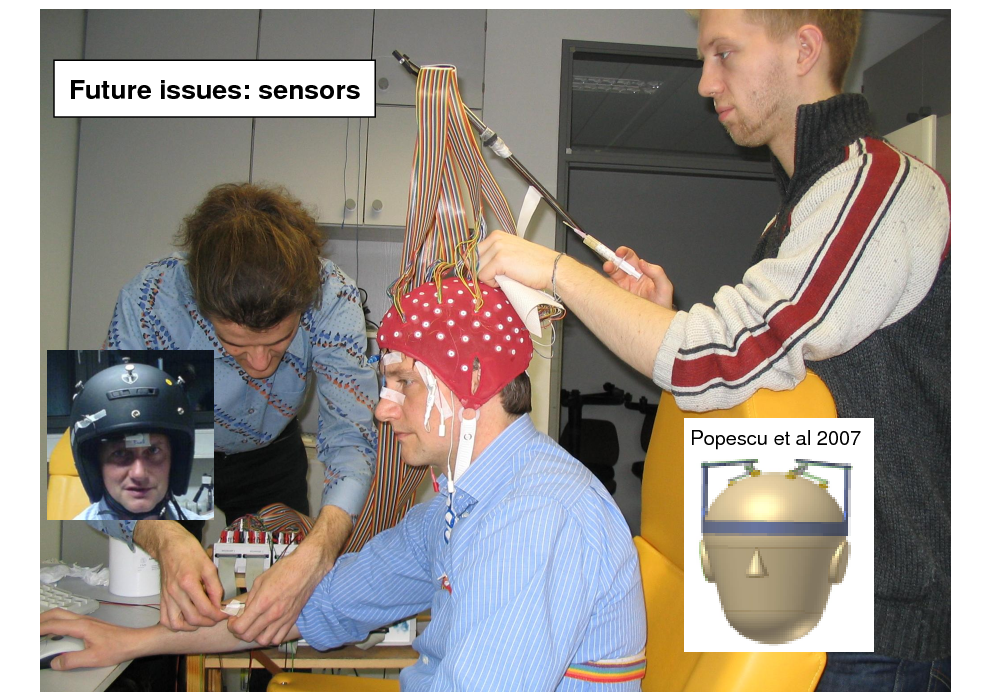
Before-after Future issues: sensors
Popescu et al 2007
188
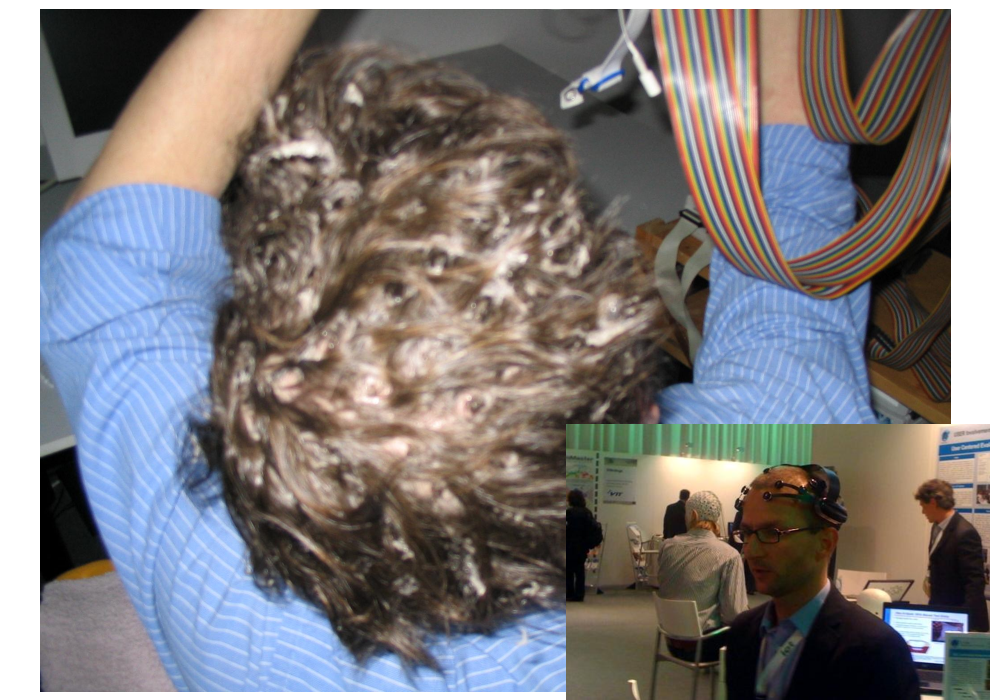
Before-after
189
190
Thanks to BBCI core team:
Gabriel Curio Florian Losch Volker Kunzmann Frederike Holefeld Vadim Nikulin@Charite
Florin Popescu Andreas Ziehe Steven Lemm Motoaki Kawanabe Guido Nolte@FIRST Yakob Badower@Pico Imaging Marton Danozci
Benjamin Blankertz Michael Tangermann Claudia Sannelli Carmen Vidaurre Siamac Fazli Martijn Schreuter Stefan Haufe Laura Acqualagna Thorsten Dickhaus Frank Meinecke Felix Biessmann@TUB
Matthias Krauledat Guido Dornhege Roman Krepki@industry
Collaboration with: U Tbingen, Bremen, Albany, TU Graz, EPFL, Daimler, Siemens, MES, MPIs, U Tokyo, TIT, RIKEN, Bernstein Center for Computational Neuroscience Berlin, Columbia, CUNY Funding by: EU, BMBF and DFG
191
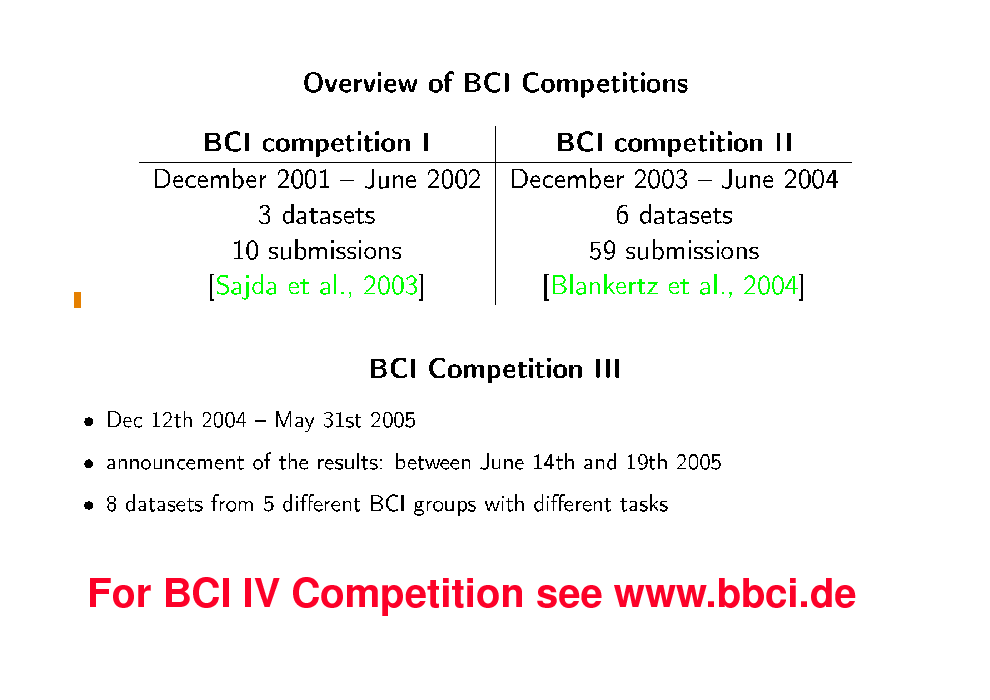
BCI Competitions
For BCI IV Competition see www.bbci.de
192
FOR INFORMATION SEE: www.bbci.de
Machine Learning open source software initiative: MLOSS see www.jmlr.org
193
194
195
196
Biased selected references
197